A common topic of student research projects is monitoring and assessing the health of rivers around Greater Manchester. This paper represents a particularly good project by Haseeb Mahmood, who was motivated enough to carry his project through to publication.
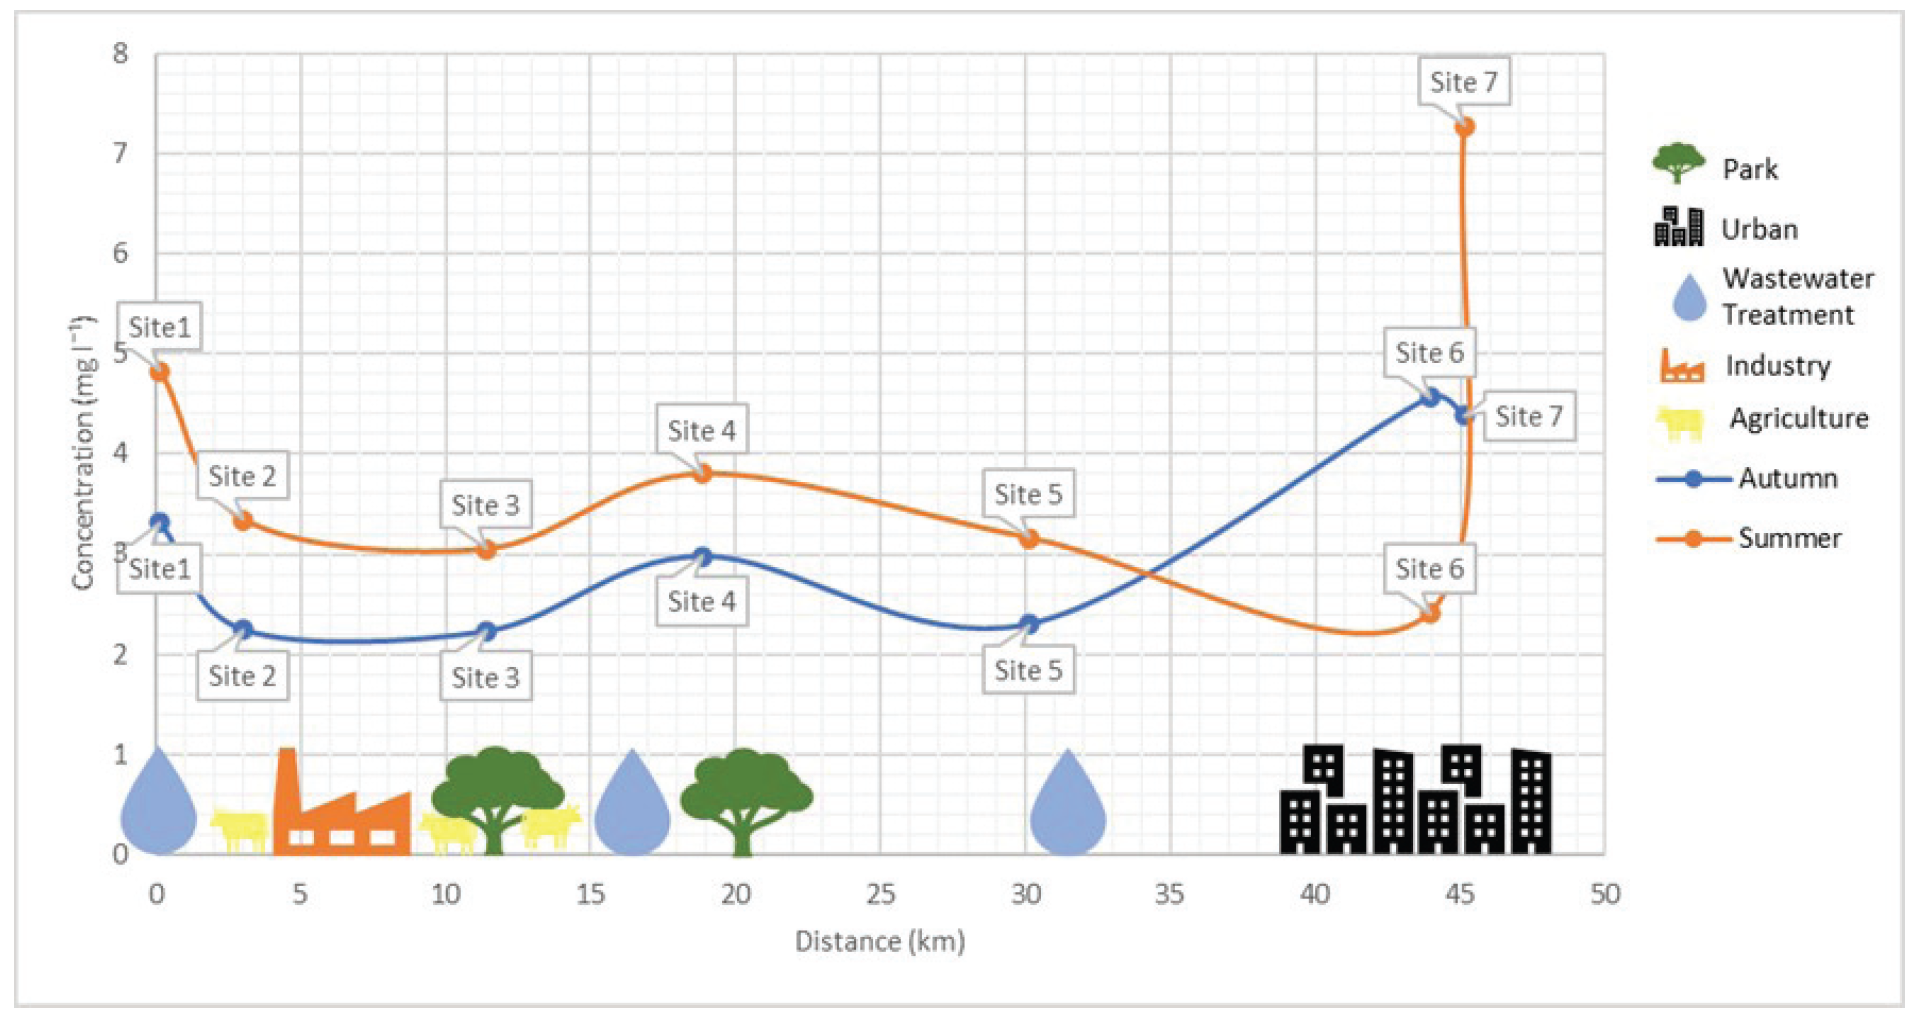
In this work, Haseeb collected water samples along the length of the River Irwell, which flows from the Pennine Moors to the Manchester Ship Canal. Along its length it passes through industrial, rural, suburban, parkland and urban environments. These all affect the river water quality. For example, there are measurable changes in biological oxygen demand and phosphate concentration as the river passes by sewage treatment works.
Reassuringly, Haseeb measured lower heavy metal concentrations in the river during summer and winter 2019-20 compared to historical measurements on the same river, indicating that clean-up activities in the last 30 years have been worthwhile.
This paper was published in the open access journal Earth Surface Dynamics, and is available through the journal website and the MMU e-space repository.
The paper is a combined effort from a large team of researchers interested in the way that organic carbon is exported from small tropical islands. These islands are very biologically productive, the forest grows quickly in the warm, wet climate. They are also responsible for delivering large amounts of sediment to the ocean. Rocks are weakened by earthquakes and then eroded by the frequent tropical storms that hit the islands. This washes sediment and carbon out to sea via two mechanisms. High sediment concentrations lead to ‘hyperpycnal’ plumes of material flowing along the ocean floor, lower sediment concentrations cause ‘hypopycnal’ flows that stay at the ocean surface. Both systems can spread sediments and carbon a long way offshore.
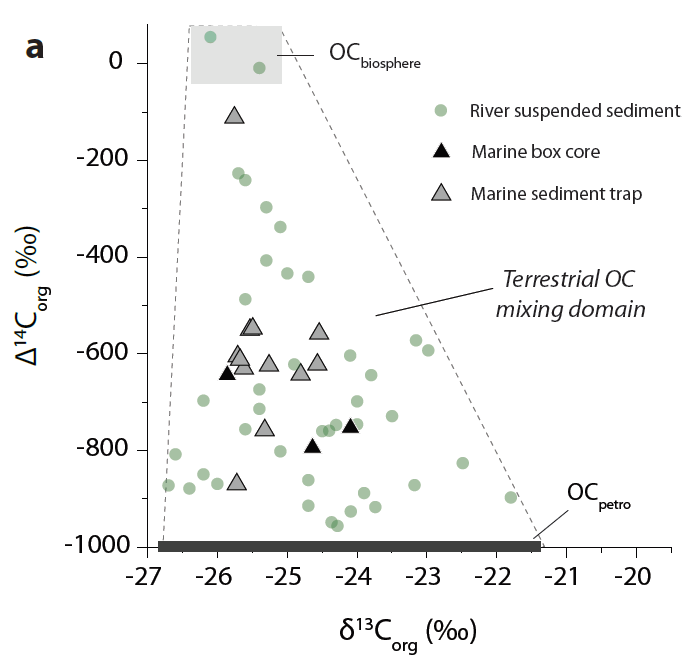
Marine sediment cores look very similar to the sediment coming out of the rivers
It had long been thought that hyperpycnal delivery of sediment, which usually only occurs in the most extreme weather conditions when floods deliver vast amounts of sediment to the ocean in a short period of time, were efficient methods of organic carbon preservation. Our data confirmed this hypothesis, showing that little terrestrial organic carbon was lost during transport, and little marine carbon added to the mixture.
However, the dataset also investigated how efficient hypopycnal delivery can be. Sediment and carbon are delivered throughout the year, in smaller floods and less extreme storms, and it had been suspected that this mechanism exposed the carbon to oxidising conditions where it could be degraded and released as CO2. We showed that in Taiwan, where hypopycnal conditions exist but are still receiving and accumulating a large amount of sediment, the burial efficiency of carbon in hypopycnal conditions is still very high. Marine carbon is mixed into the sediments, but at least 70% of the terrestrial carbon survives.
This means that small tropical islands are even better at exporting and burying carbon than was previously thought, and therefore better at sequestering atmospheric CO2. We estimated that more than 8 Teragrams (million tonnes) of carbon could be buried each year throughout Oceania.
This paper was published in Organic Geochemistry, and is available open-access through the journal website and the MMU e-space repository. In the paper we take a detailed look at lipid biomarkers along a transect from the Kolyma River to the Arctic Ocean.
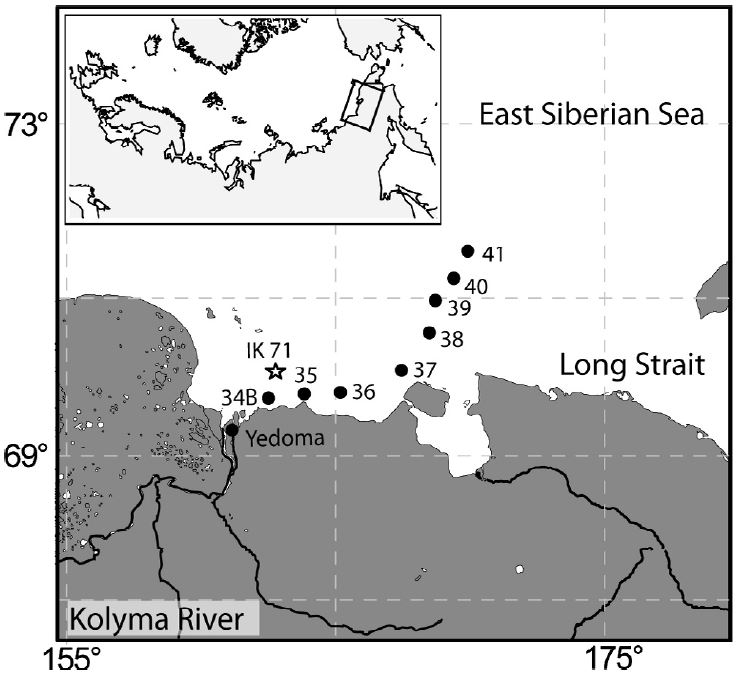
The data used in this paper is a subset of the data from across the East Siberian Artic Shelf (ESAS) published shortly afterwards in Biogeosciences. In this paper we took a closer look at the offshore trends seen in material delivered to the ocean by the Kolyma River, the easternmost of the Great Russian Arctic Rivers. The Kolyma River catchment is entirely underlain by continuous permafrost, which makes this are an extreme endmember in terms of permafrost systems. The main sources of organic matter from the Kolyma region are river erosion, mostly from top few metres of soil, the active layer that freezes and thaws each year, and coastal erosion from the “yedoma” cliffs along the shoreline.
Sample locations for the Kolyma River – ESAS transect
These samples had previously been analysed for bulk properties (total organic carbon content, carbon isotope ratios) and some basic biomarker measurements, but we added complex lipid analyses to the story. We measured both GDGT and BHP lipids, these are found in microbes and can be analysed using LCMS. Amongst the many applications of these lipids, they can be used to trace the amount of soil found in offshore sediments. Each group of molecules has an index associated with it: GDGTs are used in the BIT index and BHPs are used in the R’soil index. Values of 0 would have no soil input and 100% marine carbon, while values towards 1 would be dominated by soil.
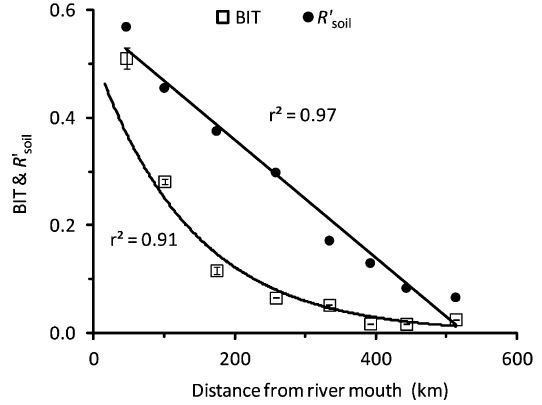
Offshore trends in the BIT and R’soil indices
Usually these indices show the same offshore trends, which would be expected since they are both supposed to be tracing the same number – the proportion of carbon coming from soil. However, as the figure above illustrates, the two indicies have very different patterns from the river mouth (0 km) across the shelf (500 km). The BIT index drops quickly offshore, making a curved offshore profile, but the R’soil index forms a straight line offshore. Therefore two different techniques, supposedly measuring the same thing, don’t show the same results.
We think that this is due to the source of lipids used to make each index. Branched GDGTs (from soils) are common in sediments close to the river mouth, but their concentration drops quickly offshore. Marine GDGT concentrations increase across the shelf and this combination causes the BIT index to decrease rapidly. Branched GDGT concentrations in soils and lakes on land are high, but they are very rare in the coastal permafrost cliffs. Therefore any coastal erosion is not really affecting the BIT index.
On the other hand, soil marker BHP molecules are found in river sediment and coastal permafrost, and so there are two terrestrial sources. The concentration of soil marker BHPs drops much slower offshore than for the GDGTs. Also different, the concentration of the marine BHP marker doesn’t increase offshore. This combination means that the R’soil index drops much slower than the BIT index.
In the end, what this paper mainly shows is that when using biomarkers as proxy measurements for something else one single result is probably not enough. Proxy measurements are valuable tools, but they depend on measuring one thing to discover another. Combining multiple proxies together adds value and reliability to a study, either by confirming a hypothesis or bringing new insights.
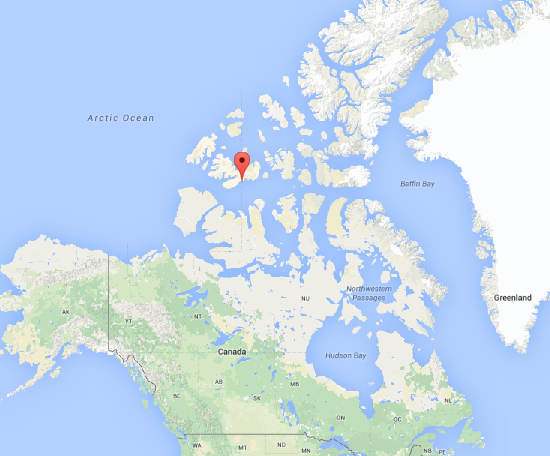
The February issue of “Organic Geochemistry” will include a paper by David Grewer and colleagues from the University of Toronto and Queen’s University, Canada which investigates what happens to organic carbon in the Canadian High Arctic when the surface permafrost layer slips and erodes. This is a paper that I was involved in, not as a researcher but as a reviewer, helping to make sure that published scientific research is novel, clear and correct.
Map of Cape Bounty in the Canadian High Arctic
The researchers visited a study site in Cape Bounty, Nunavut, to study a process known as Permafrost Active Layer Detachments (ALDs). The permafrost active layer is the top part of the soil, the metre or so that thaws and re-freezes each year. ALDs are erosion events where the thawed top layer is transported down the hillslope and towards the river. Rivers can then erode and transport the activated material downstream towards the sea.
The team used organic geochemistry and nuclear magnetic resonance spectroscopy to find out which chemicals were present in the river above and below the ALDs. The found that the sediment eroded from the ALDs contains carbon that is easily degraded and can break down in the river, releasing CO2 to the atmosphere and providing food for bacteria and other micro-organisms in the water.
Russia is big, reallybig, and to go with that, it has some very big rivers. The majority of the Russian river outflow is into the Arctic Ocean, especially in the central and eastern parts of the country, and this is generally concentrated into a series of very large rivers. The largest of these are known as the Great Russian Arctic Rivers (GRARs). From west to east, these are the Ob, Yenisety, Lena, Indigirka and Kolyma, of which the Ob and Lena are largest, and Indigirka the smallest (small enough to not count in some people’s list of GRARs).
Catchment areas of the Great Russian Arctic Rivers
The Ob river is the world’s fifth-longest and has the sixth-largest drainage basin, yet has only the 19th highest annual discharge, being overtaken by the smaller Yenisey and Lena rivers to the east of it. All of these river basins contain some permafrosted land, which can reduce discharge during the winter months and have a very large flood-period in late spring / early summer when the meltwater arrives (the “freshet”).
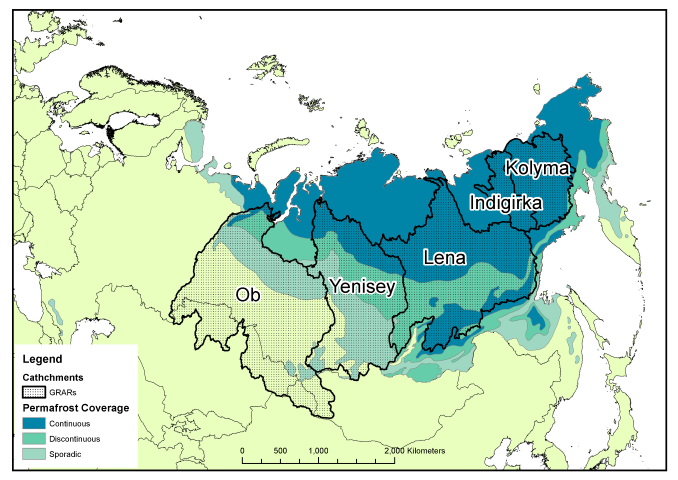
Permafrost within catchments of the GRARs
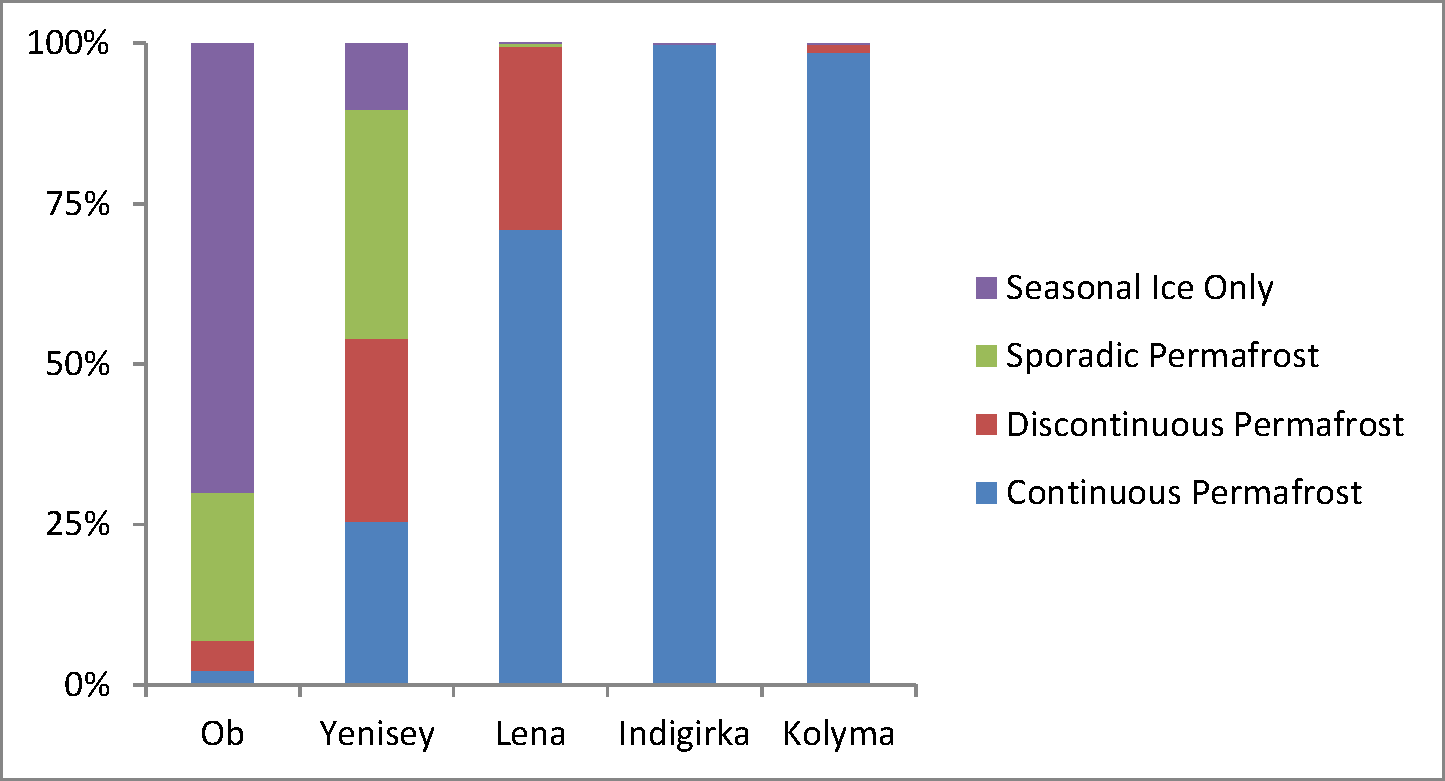
As the amount and continuity of permafrost increases from west to east, so the proportion of each permafrost type increases within the river basin. The Ob and Yenisey are largely free of continuous permafrost, allowing water to flow through the ground to the bedrock and into the river, whilst the Indigirka and Kolyma are practically 100% continuous permafrost, and thus any water discharging will have run along the top of the ground before entering the river itself. This can have consequences for the type of material, especially carbon, carried by the rivers.
Proportion of each type of permafrost within river basins
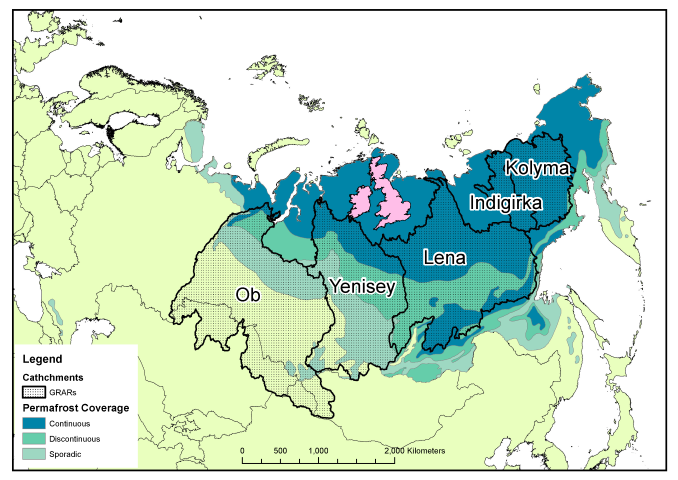
This east-west contrast is worth exploring in more detail in a later post, since it shows how Siberia may behave very differently if the permafrost were to thaw. As a final reminder of just how large the rivers are, even the smallest, Indigirka, manages to cover more area than the British Isles! As usual the full-resolution PDFs of the figures from this article can be downloaded here: River catchments no permafrost, Catchments and permafrost, Permafrost chart, Catchments and UK.
Comparing the catchment areas to the British Isles