Source, transport and fate of soil organic matter inferred from microbial biomarker lipids

06/09/2016 UPDATE: The paper has been accepted and is now published. The final version is available from the journal.

Our international team of East Siberian researchers currently has a paper in open review at Biogeosciences. The discussion paper, and its interactive comments, can be downloaded from the  journal website.

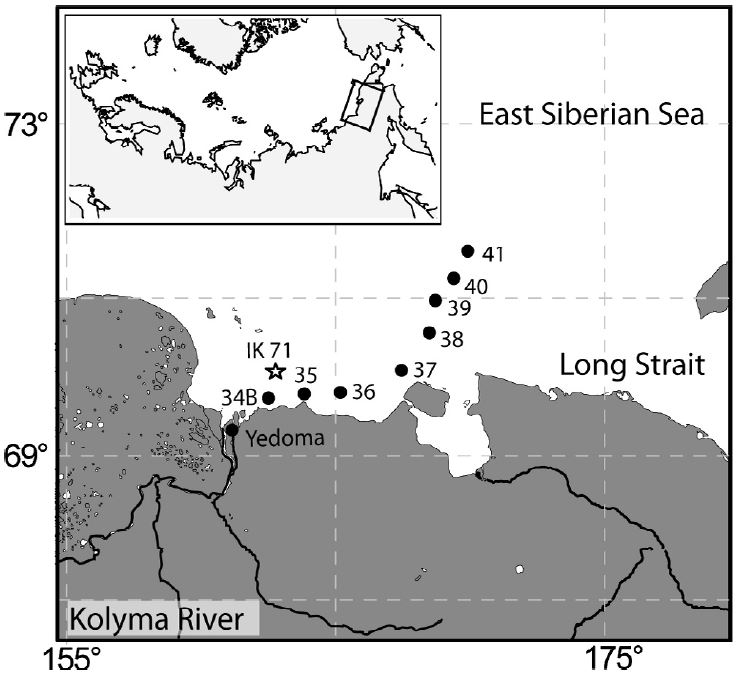
The paper studies a group of compounds called “bacteriohopanepolyols” (BHPs for short), which are found in the cell membranes of a range of microbes and are therefore one of the most common organic compounds around. They are found in modern and ancient sediments from all over the world. This study has concentrated on two groups of these. Group 1 is the soil marker compounds. These are only found in soils, and so have been used as tracers for soil material in rivers, lakes and offshore. Here is how they are spread across the East Siberian Artic Shelf:

BHPfig2a (Custom)
Soil marker compounds across the Arctic Shelf

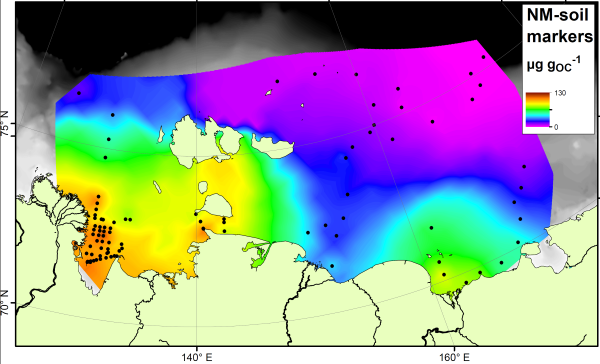
Note how the soil marker concentrations are highest (orange colours) near to the rivers and coastlines. By measuring the concentration next to the river mouths, and in the sediments being washed away by coastal erosion, we show that it is not just rivers that are delivering the soil markers to the Arctic Ocean.

There is no single compound that is a true tracer for carbon produced in the ocean itself, but the compound bacteriohopanetetrol (BHT) is most abundant in marine settings despite being found in soils as well. Therefore if your sample is rich in BHT, and poor in soil markers, it is likely dominated by carbon from the ocean. Here’s a map of BHT across the East Siberian Arctic Shelf:

BHPfig2b (Custom)
BHT, a marine marker, is present across the Arctic Shelf

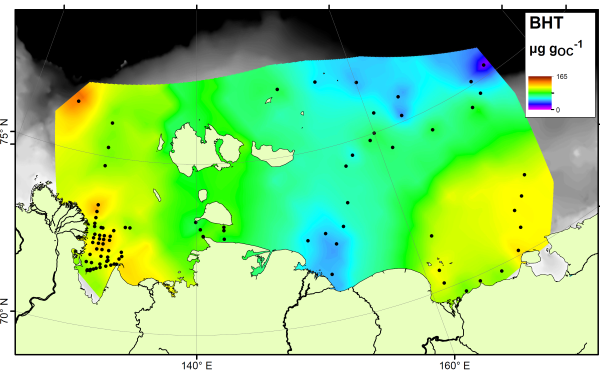
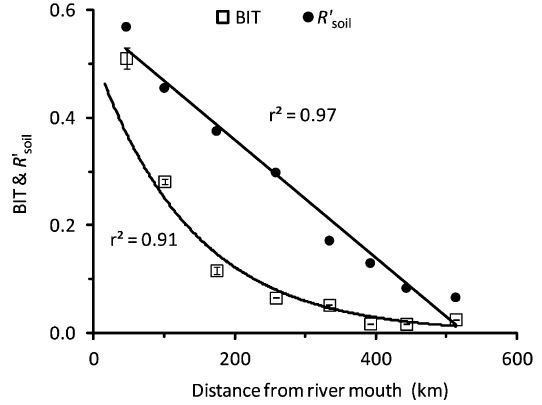
The BHT results show a fairly constant amount across the ocean floor. If we compare the soil marker concentrations to the BHT concentrations, we can see which areas are rich in soil carbon (more soil markers than BHT) and which are rich in marine carbon (more BHT than soil markers). This comparison is called the R’soil index, and is shown below:

R'soil index on the Arctic Shelf
R’soil index on the Arctic Shelf

The R’soil index shows that all along the East Siberian Arctic coastline, offshore sediments are dominated by carbon from the land. As you go further offshore, especially in eastern parts nearer to the Pacific Ocean, marine carbon is more important. This result shows a similar pattern to that seen using stable carbon isotopes, but is different to the pattern shown by the BIT index. Therefore these two indices, both based on microbial biomarkers, are tracing different parts of the carbon cycle.

Distributions of bacterial and archaeal membrane lipids in surface sediments reflect differences in input and loss of terrestrial organic carbon along a cross-shelf Arctic transect

This paper was published in Organic Geochemistry, and is available open-access through the journal website and the MMU e-space repository. In the paper we take a detailed look at lipid biomarkers along a transect from the Kolyma River to the Arctic Ocean.

The data used in this paper is a subset of the data from across the East Siberian Artic Shelf (ESAS) published shortly afterwards in Biogeosciences. In this paper we took a closer look at the offshore trends seen in material delivered to the ocean by the Kolyma River, the easternmost of the Great Russian Arctic Rivers. The Kolyma River catchment is entirely underlain by continuous permafrost, which makes this are an extreme endmember in terms of permafrost systems. The main sources of organic matter from the Kolyma region are river erosion, mostly from top few metres of soil, the active layer that freezes and thaws each year, and coastal erosion from the “yedoma” cliffs along the shoreline.

Sample locations for the Kolyma River - ESAS transect
Sample locations for the Kolyma River – ESAS transect

These samples had previously been analysed for bulk properties (total organic carbon content, carbon isotope ratios) and some basic biomarker measurements, but we added complex lipid analyses to the story. We measured both GDGT and BHP lipids, these are found in microbes and can be analysed using LCMS. Amongst the many applications of these lipids, they can be used to trace the amount of soil found in offshore sediments. Each group of molecules has an index associated with it: GDGTs are used in the BIT index and BHPs are used in the R’soil index. Values of 0 would have no soil input and 100% marine carbon, while values towards 1 would be dominated by soil.

Offshore trends in the BIT and R'soil indices
Offshore trends in the BIT and R’soil indices

Usually these indices show the same offshore trends, which would be expected since they are both supposed to be tracing the same number – the proportion of carbon coming from soil. However, as the figure above illustrates, the two indicies have very different patterns from the river mouth (0 km) across the shelf (500 km). The BIT index drops quickly offshore, making a curved offshore profile, but the R’soil index forms a straight line offshore. Therefore two different techniques, supposedly measuring the same thing, don’t show the same results.

We think that this is due to the source of lipids used to make each index. Branched GDGTs (from soils) are common in sediments close to the river mouth, but their concentration drops quickly offshore. Marine GDGT concentrations increase across the shelf and this combination causes the BIT index to decrease rapidly. Branched GDGT concentrations in soils and lakes on land are high, but they are very rare in the coastal permafrost cliffs. Therefore any coastal erosion is not really affecting the BIT index.

On the other hand, soil marker BHP molecules are found in river sediment and coastal permafrost, and so there are two terrestrial sources. The concentration of soil marker BHPs drops much slower offshore than for the GDGTs. Also different, the concentration of the marine BHP marker doesn’t increase offshore. This combination means that the R’soil index drops much slower than the BIT index.

In the end, what this paper mainly shows is that when using biomarkers as proxy measurements for something else one single result is probably not enough. Proxy measurements are valuable tools, but they depend on measuring one thing to discover another. Combining multiple proxies together adds value and reliability to a study, either by confirming a hypothesis or bringing new insights.

Arctic sea ice over one year

As 2014 draws to a close, what were the key features of the Arctic climate this year? Today let’s look at the sea ice coverage. The US National Snow and Ice Data Centre has a monthly running commentary on ice cover on their website, and in general 2014 has been “extremely ordinary”, by which they mean that sea ice grew and shrank at roughly the rates of the last few years. Ice cover was not as low as 2012, the record-breaking year for sea ice retreat, instead it was pretty average for recent times. Remember that this is still way down on the long-term average.

Monthly Arctic sea ice cover for the last few years (NSIDC)

Using their monthly data, here is an animation of the sea ice changes over the last 12 months. It’s a reminder of just how dynamic the Arctic is. Sea ice cover is important for a number of reasons. First of all, the white colour reflects sunlight that shines onto the ice surface during the summer. Reflecting sunlight back into space means that it does not stay around to warm our planet, so having a decent covering of ice helps to regulate temperatures. As the summer sea ice cover has decreased in recent years, the amount of sunlight reflected back into space has decreased, meaning that there is a positive temperature feedback at work here.

animsm
Arctic sea ice cover over the last year

Sea ice cover is also important for the Arctic Ocean’s biological cycle. Many plankton require sunlight for photosynthesis, so the retreat of sea ice during the spring and summer causes a bloom in biological productivity in the surface ocean which feeds down the food chain, supporting large numbers of fish and whales. As organic geochemists, we can see this plankton bloom by looking in the ocean sediments biomarkers. There are specific chemicals that are produced by marine organisms that can be used to track the productivity, and it seems that there is a direct link between the ice-free areas and the highest amount of biological activity.