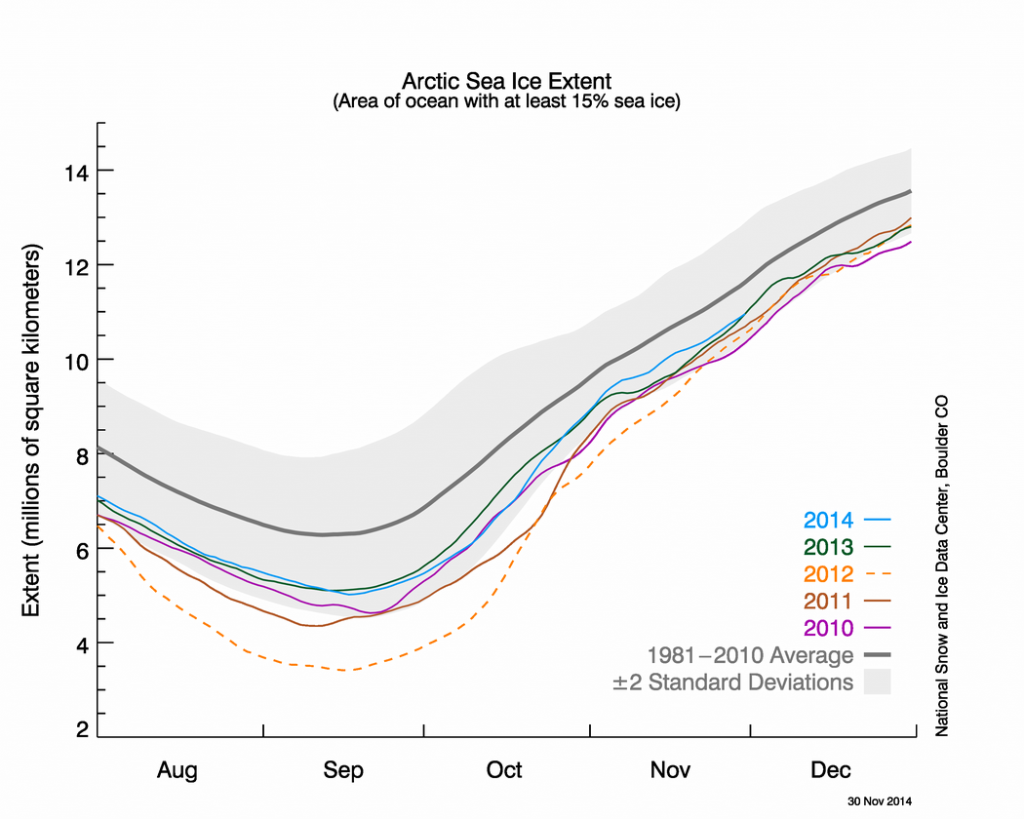
As 2014 draws to a close, what were the key features of the Arctic climate this year? Today let’s look at the sea ice coverage. The US National Snow and Ice Data Centre has a monthly running commentary on ice cover on their website, and in general 2014 has been “extremely ordinary”, by which they mean that sea ice grew and shrank at roughly the rates of the last few years. Ice cover was not as low as 2012, the record-breaking year for sea ice retreat, instead it was pretty average for recent times. Remember that this is still way down on the long-term average.

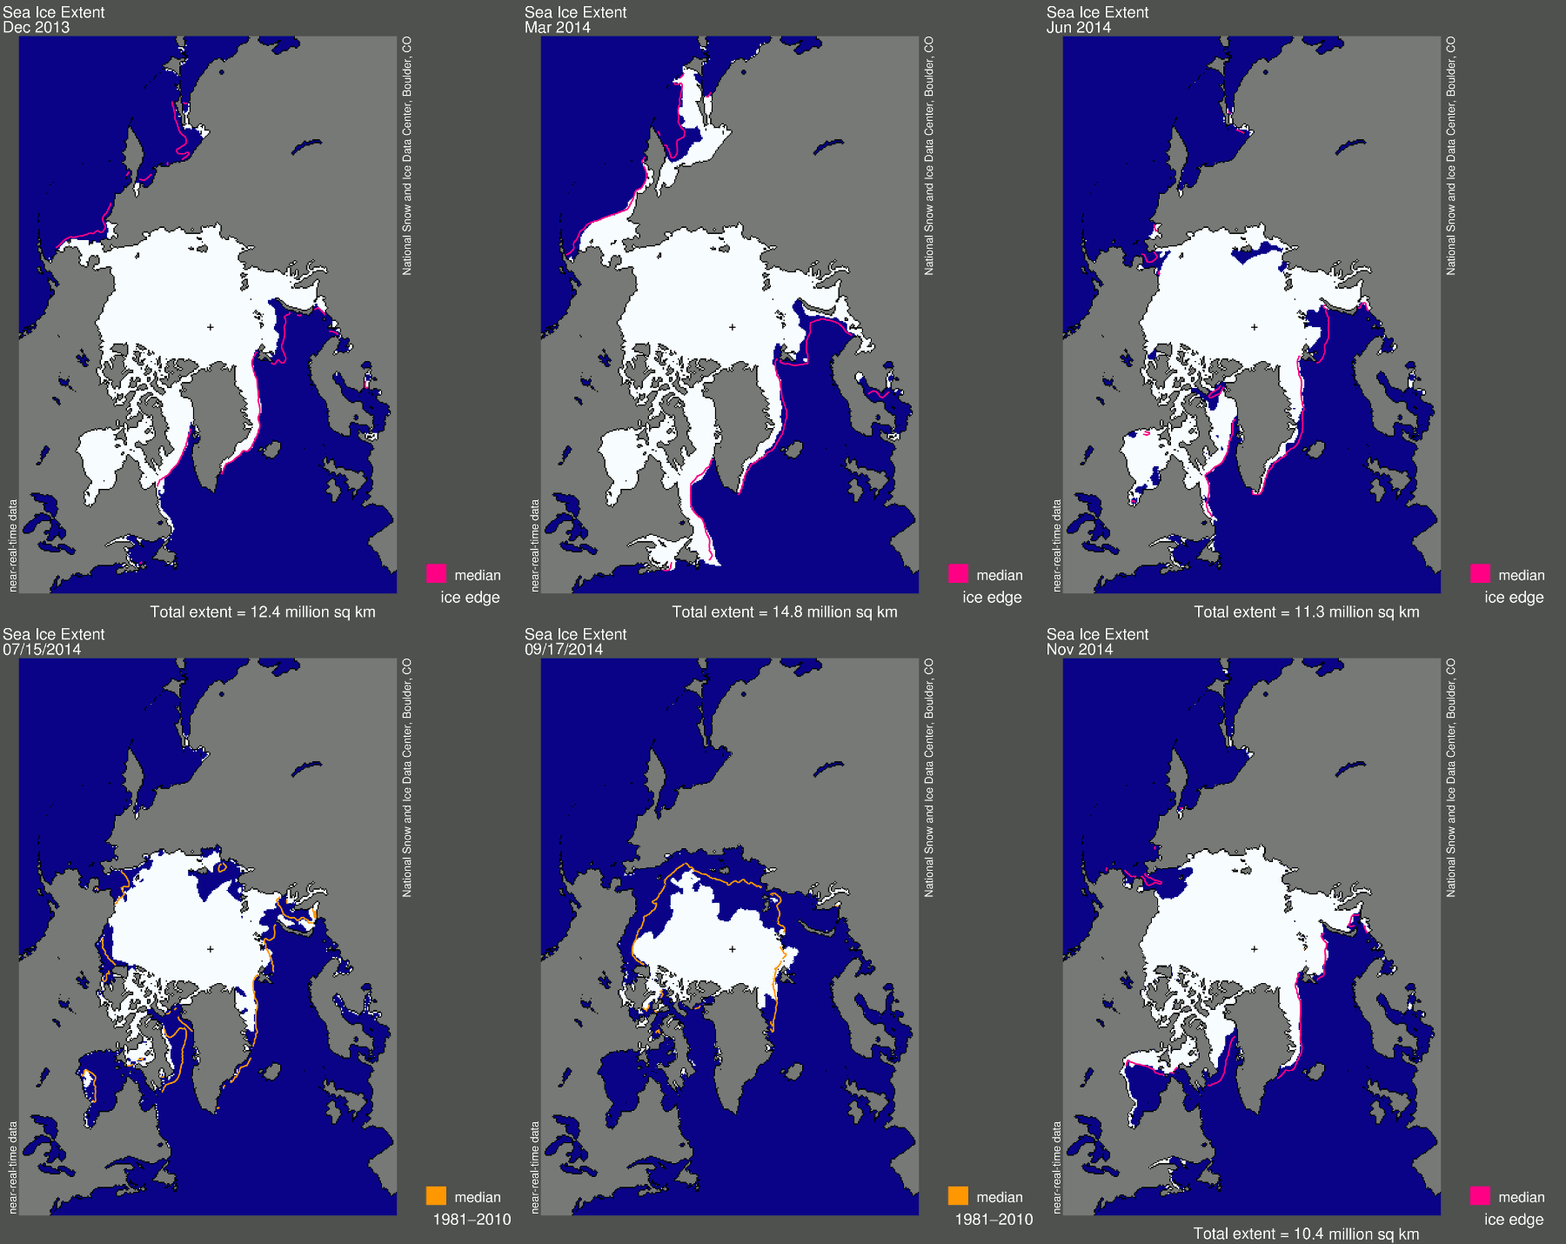
Using their monthly data, here is an animation of the sea ice changes over the last 12 months. It’s a reminder of just how dynamic the Arctic is. Sea ice cover is important for a number of reasons. First of all, the white colour reflects sunlight that shines onto the ice surface during the summer. Reflecting sunlight back into space means that it does not stay around to warm our planet, so having a decent covering of ice helps to regulate temperatures. As the summer sea ice cover has decreased in recent years, the amount of sunlight reflected back into space has decreased, meaning that there is a positive temperature feedback at work here.

Sea ice cover is also important for the Arctic Ocean’s biological cycle. Many plankton require sunlight for photosynthesis, so the retreat of sea ice during the spring and summer causes a bloom in biological productivity in the surface ocean which feeds down the food chain, supporting large numbers of fish and whales. As organic geochemists, we can see this plankton bloom by looking in the ocean sediments biomarkers. There are specific chemicals that are produced by marine organisms that can be used to track the productivity, and it seems that there is a direct link between the ice-free areas and the highest amount of biological activity.

