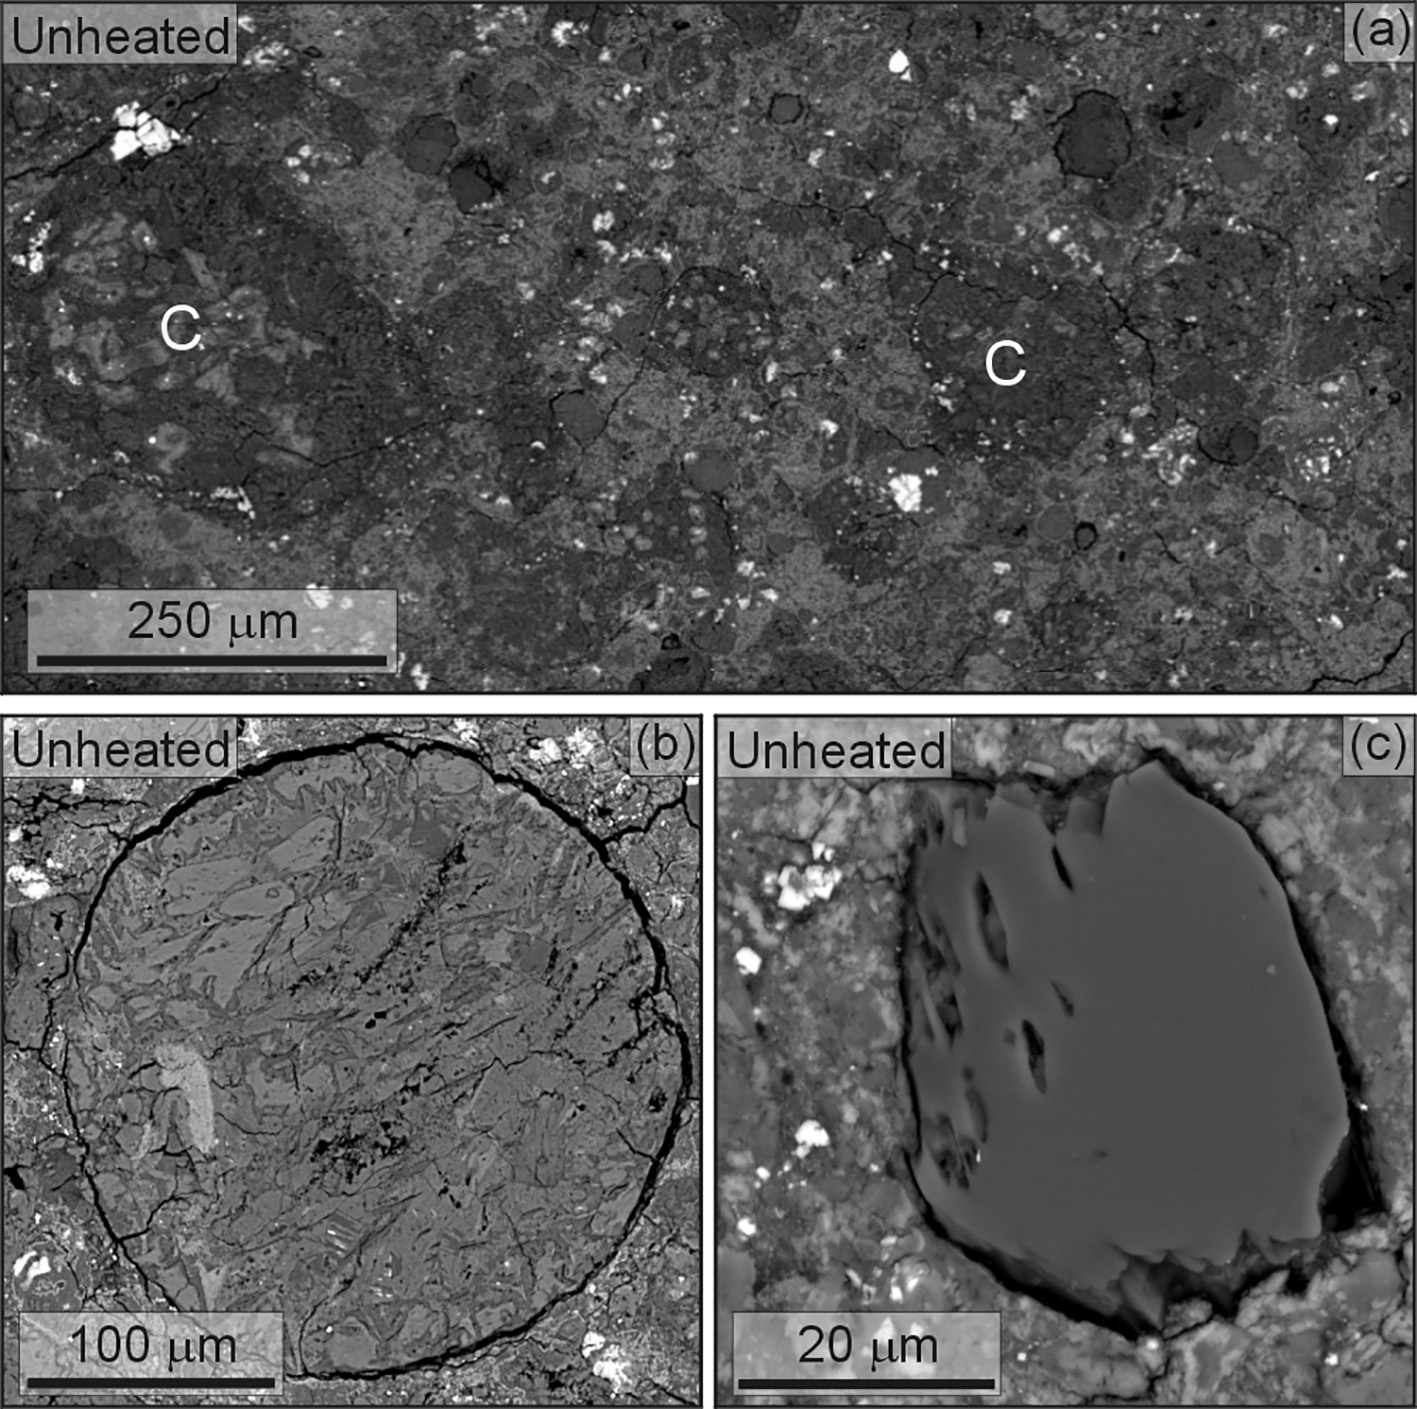
Backscatter electron microscope images of a meteorite
This paper is available as an Open Access article via the journal.
This research paper continues the work of Paula Lindgren, who I worked with earlier when looking at a suite of meteorites. In this paper, a single carbonaceous chondrite meteorite was heated in the laboratory to simulate the heating that took place during the life of a meteorite. A sample was studied using a series of different techniques, including scanning electron microscopy, Raman spectroscopy, infra-red spectroscopy, oxygen isotopic analysis and X-ray diffraction. It was then heated to 400 °C and 800 °C and studied again. We found that the minerals, isotopes and organic matter all changed with heating. Sometimes 400 °C was enough to make a change, sometimes no change was observed until 800 °C.
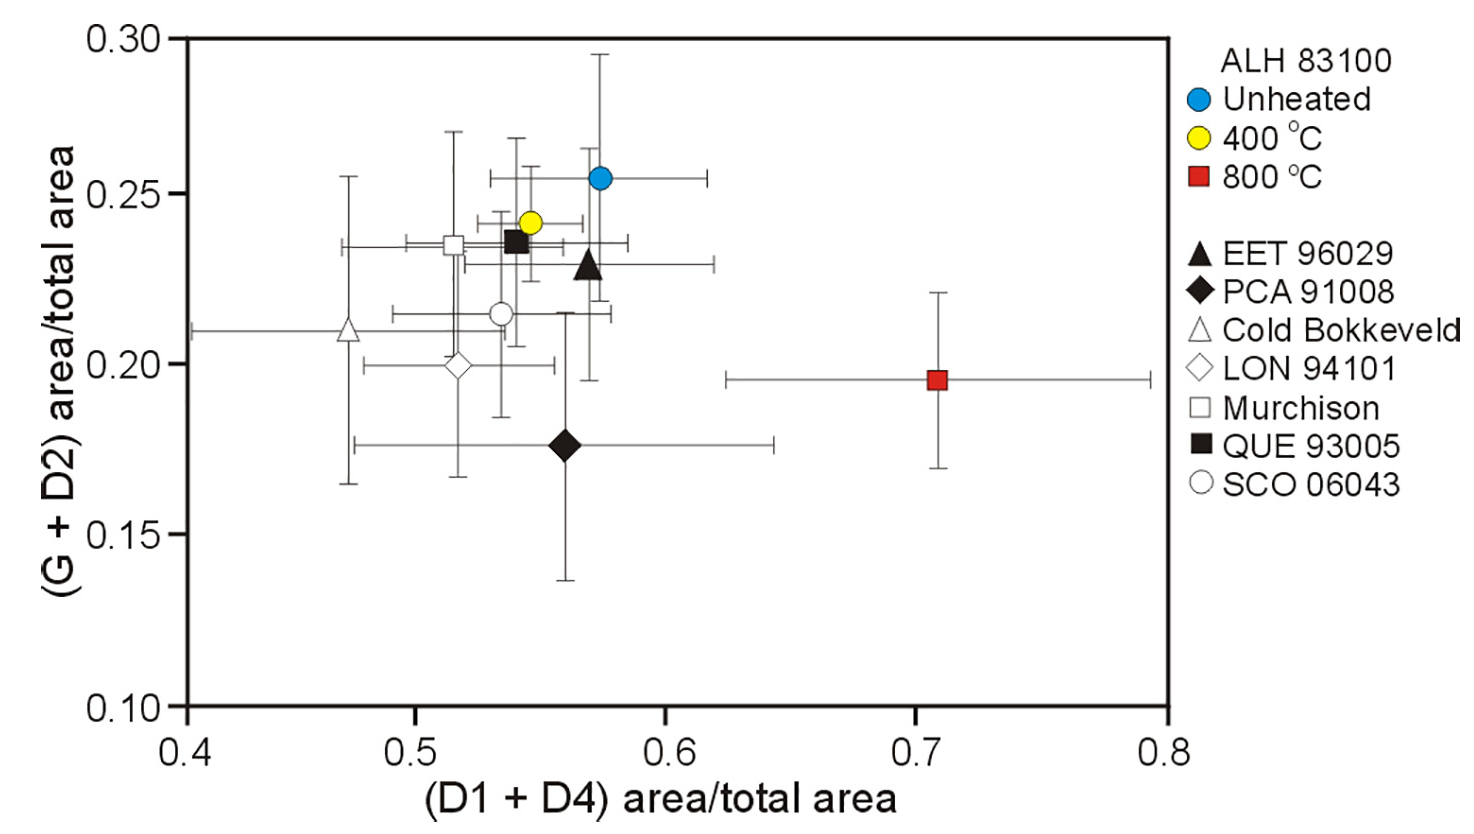
Changing Raman spectropscopy measurements from unheated (blue), 400 °C (yellow) and 800 °C (red) samples of the same meteorite
These changes can be used to work out the thermal history of meteorites collected on Earth, and even for asteroids sampled in space!
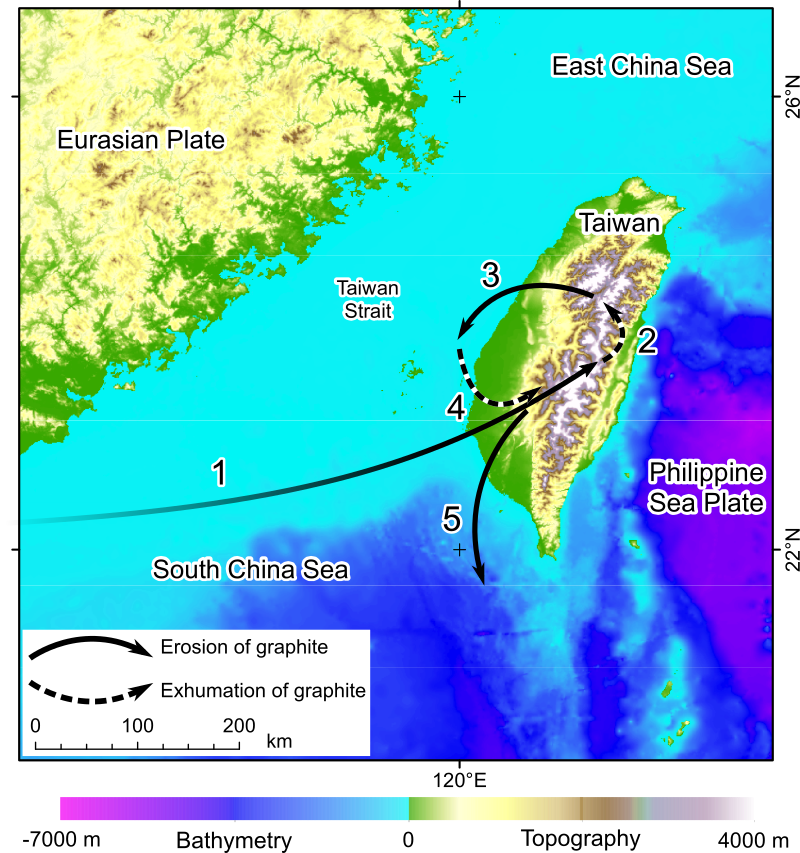
This paper shows how organic carbon, when deeply buried and transformed into graphite, can survive multiple cycles of erosion, transport and burial. It is available, open-access, from the journal website.
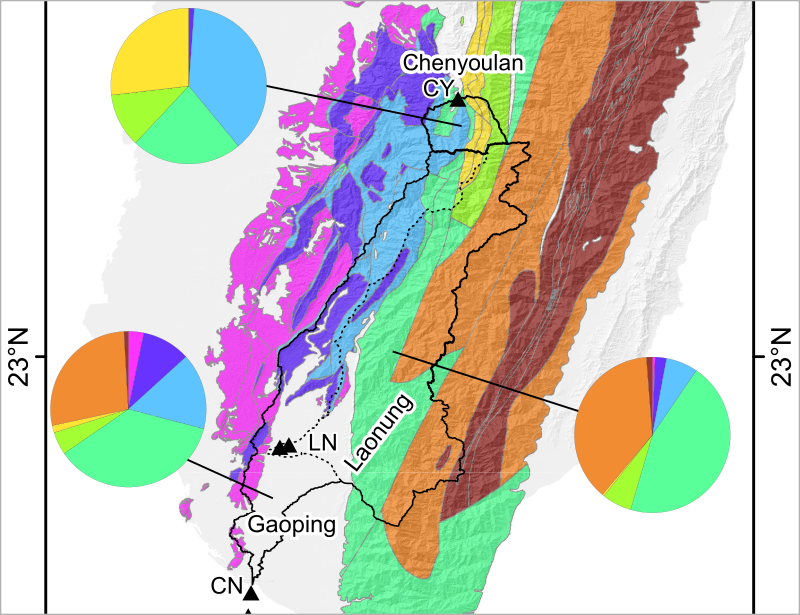
River catchments in southwestern Taiwan contain lots of different rock formations
The samples came from Taiwan, which has a pretty extreme tectonic and climatic setting. The convergence of the Eurasian and Philippine Sea plates leads to rapid mountain building, and the impact of severe typhoons each year leads to large amounts of erosion. This means that lots of sediment is removed from the island each year, including from rocks that were previously buried deep under the island, and metamorphosed. I looked at samples collected from several river catchments in the southwestern part of the island, and from some offshore cores. Some of these catchments drained the Central Range mountains, and others the Western Foothills and Coastal Plain. The rocks in these two regions are very different, especially in terms of the carbon they contain.
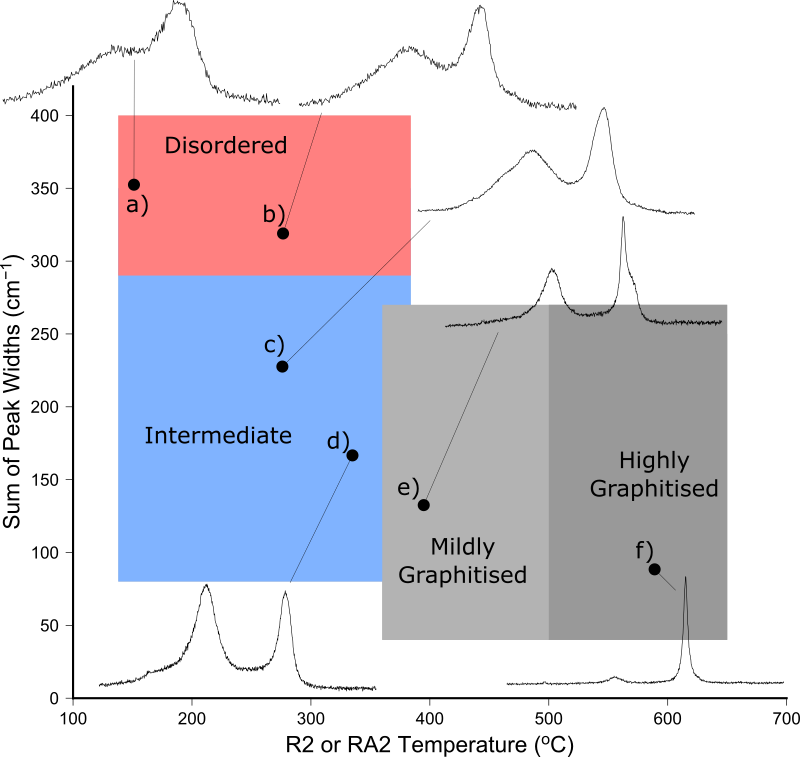
Differentiating betwen graphitic and disordered carbon using Raman spectra
The analytical work was based around the Raman spectroscopy technique I developed during my PhD (published back in 2013). Raman spectra were collected from particles of organic carbon in the sediments, and automatically processed to determine which Raman peaks were present, where they were located, how tall and how wide they were. The peaks found in each sample were used to show the types of carbon present in each rock. As each particle is analysed independently, there is no averaging effect if a samples is a mixture of several sources.
This analysis showed that rivers draining the youngest rocks, which had experienced the least metamorphism, had the most graphite in. The rivers draining the most metamorphic rocks had little or no graphite. This could only be explained if the graphite was eroded from somewhere else and then deposited into the Taiwanese sediments before they became rocks. The graphite-rich rocks were sourced from Taiwan itself – the rapid tectonic uplift means that a lot of material has been removed from the top of the mountains and washed into the surrounding ocean. Yet there are no rocks in Tawain that have been buried deep enough to make graphite, so the original graphite must have come from somewhere else entirely!
Three phases of graphite erosion (arrows 1, 3 and 5) and two of exhumation in the island of Taiwan (arrows 2 and 4)
Our best guess is that China was the original graphite source, since there are lots of graphite bearing outcrops in the regions near to Taiwan, eroding into the South China Sea. So the first phase of recycling was from China out onto the ocean floor before Taiwan became an island. Once the island appeared out of the ocean, the second phase of erosion moved these graphite rich sediments from the newly formed land back into the nearby seas (the second recycling phase). These rocks were then uplifted themselves, forming the Western Foothills of the island, and are now eroding for the third time out into the South China Sea. During all this time, some of the graphite has survived, and can be seen easily in the modern sediment.
All this means that graphite crystals are pretty stable, and can survive being eroded, transported and buried in sediments multiple times. They can be used as tracers, because although the rock they came from has been broken up into tiny pieces and dispersed across the ocean floor, each graphite flake can be characterised very precisely by Raman.
Turning organic carbon into graphite also gives it stability, stopping it from degrading back into carbon dioxide. On long timescales, this means that carbon is transferred from the atmosphere into the biosphere (trees and plants), and then into the lithosphere (rocks) where it can survive for millions of years.
I hosted the 2019 British Organic Geochemical Society conference at Manchester Met. Personally, I think it was a huge success and would like to reiterate my thanks to all of the delegates for making it a fantastic event, to the sponsors for providing the icebreaker, conference dinner, and prizes, and to the Ecology and Environment Research Centre for subsidising the conference fees. Conference abstracts are archived here.
In this paper, published in The Cryosphere, we used Raman spectroscopy to trace carbonaceous material from the shoreline to the furthest reaches of the East Siberian Arctic Shelf.
Raman spectroscopy uses laser light to determine the molecular structure of a wide range of materials. During my PhD, I showed that Raman could be used to probe individual particles of organic carbon to show whether they were disordered, like coal, or crystalline sheets of graphite. This collection of carbon particles, known as carbonaceous materials, are particularly hardwearing and resistant to breaking down during erosion and transport. During my post-doctoral research, I then used a range of organic geochemistry techniques to investigate the transition from terrestrial to marine carbon across the East Siberian Arctic Shelf, showing that coastal erosion and river erosion were both supplying organic matter to the ocean.
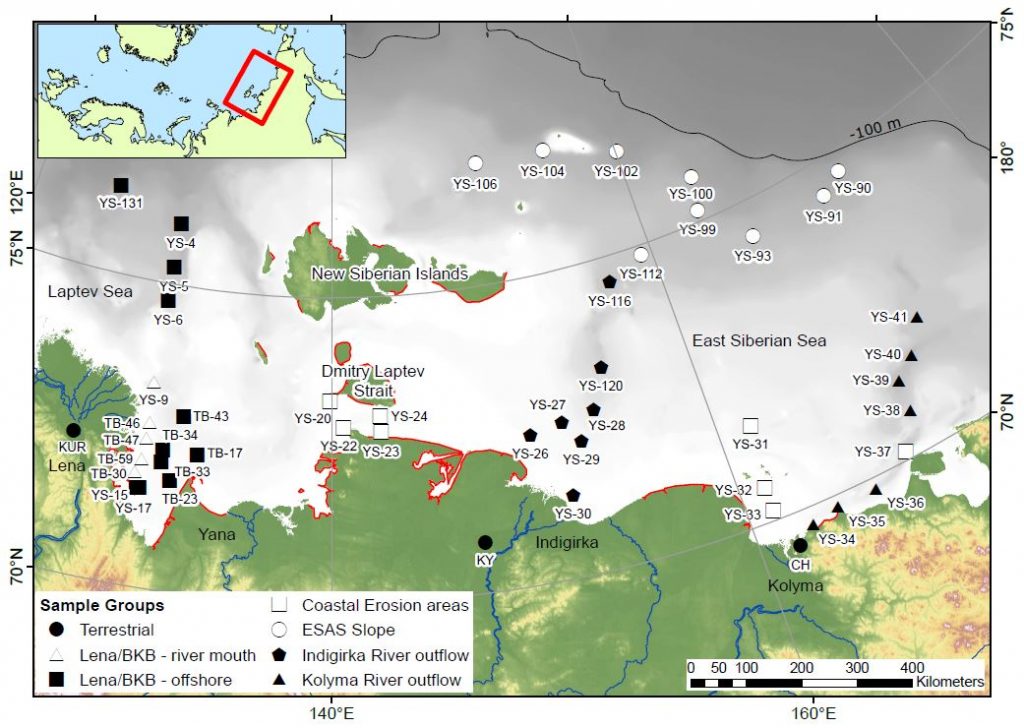
Map of the samples used in this study. Red lines are areas of intense coastal erosion
This study uses the Raman technique on those same Arctic Shelf sediments to look at the sources and distribution of carbonaceous material on the shelf. The samples used in our paper were collected from close to the mouths of some major rivers, from areas experiencing rapid coastal erosion, and from hundreds of kilometres offshore.
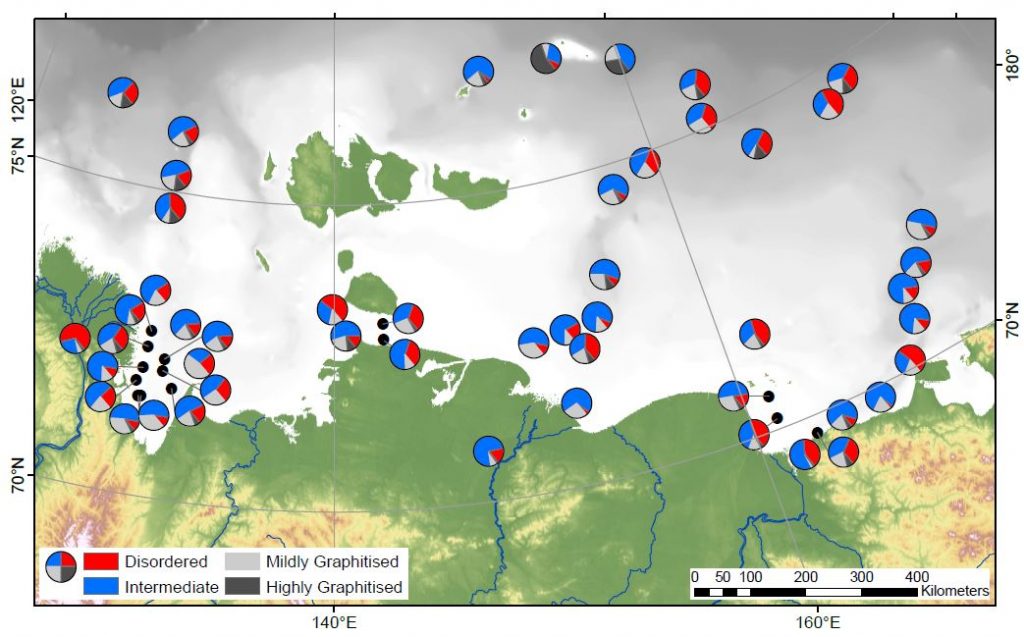
Groups of spectra found in the shelf samples
The hardest work, collecting over 1400 Raman spectra, was carried out by two undergraduate students, Melissa Maher and Jerome Blewett, who are co-authors on the paper. The collected spectra were then analysed using an automated peak fitting script, and grouped according to the shape of the fitted peaks. This provides an unbiased method for determining whether a carbon particle is highly graphitised, mildly graphitised, disordered, or somewhere in between. For each of the sites on the shelf we collected spectra from up to 30 particles, and looked at how many fitted into each group. Statistics were then used to spot patterns across the shelf.
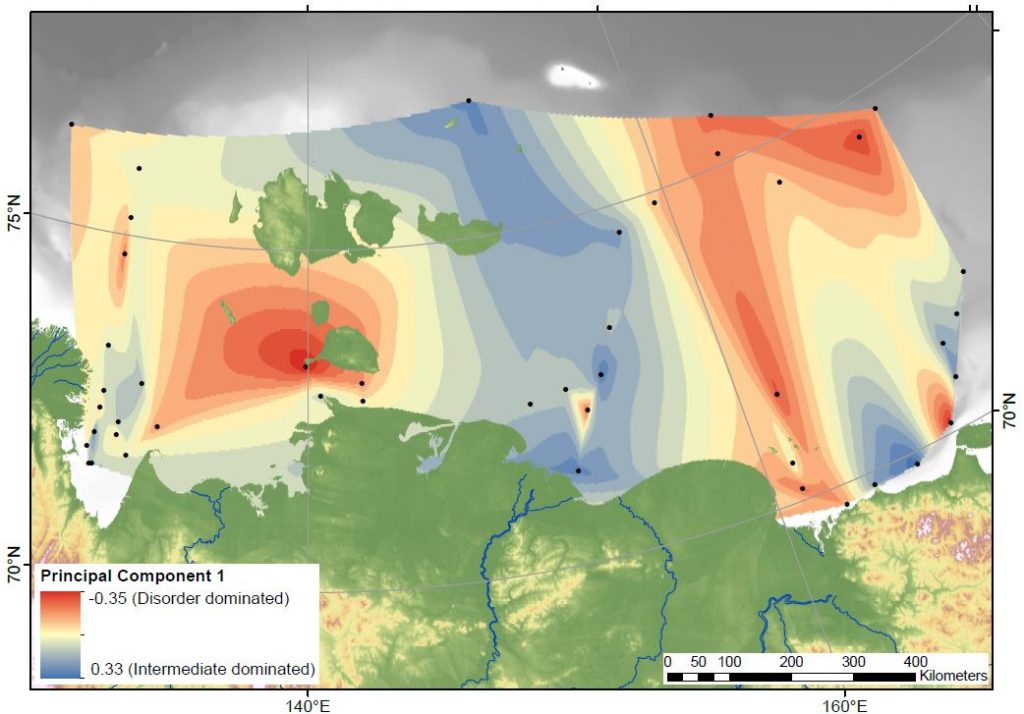
Distribution of “Disordered” and “Intermediate” carbon
Our first finding is that the relative proportion of “disordered” and “intermediate” carbon particles varies, and that there are patches with more of one or the other group. At the coastline these patches align with two of the major rivers (Kolyma and Indigirka) and areas of rapid coastal erosion. Surprisingly, the patches can then be traced all the way across the shelf. We would have expected the currents in the ocean to have mixed the particles together further offshore, and in the biomarker studies we’ve done before we did not spot this kind of pattern. This means that Raman is a great way to trace the different sediment and carbon sources on the shelf.
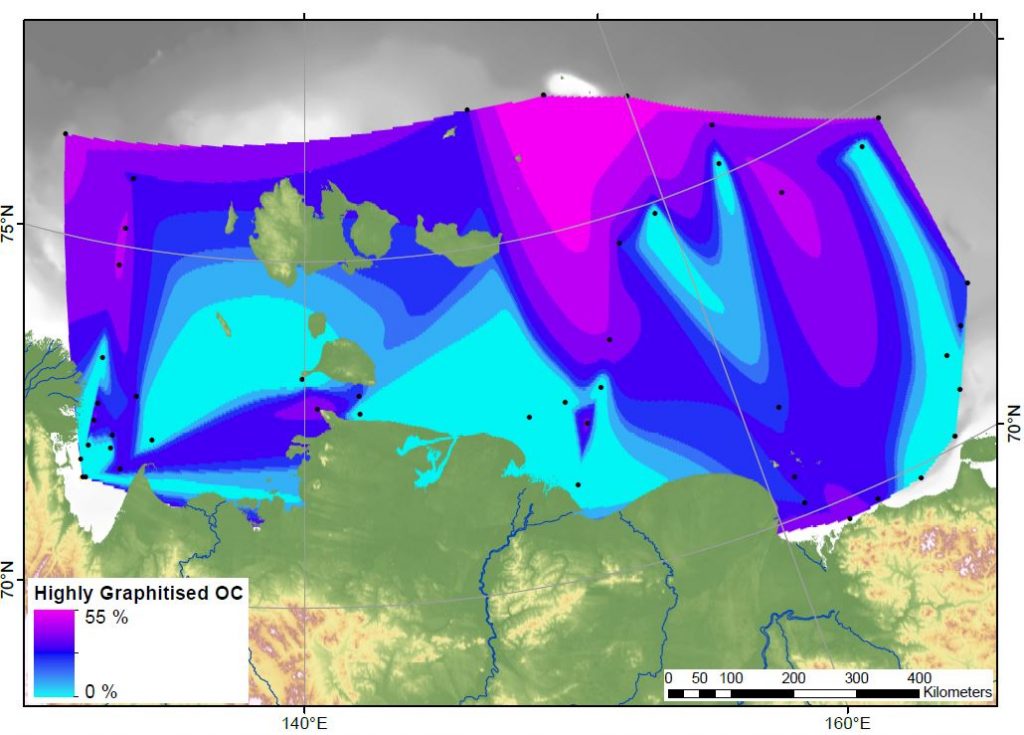
“Highly Graphitised” carbon is found in high proportions far offshore
Our second finding is that the amount of “highly graphitised” carbon particles is highest in the furthest offshore samples. These very crystalline flakes of graphite are behaving differently to all the other carbon particle groups. It’s not clear exactly why this is, but one option is that everything else is breaking down and degrading before getting that far offshore. Or, the graphite particles could be so light that they sink very slowly, floating out to the shelf edge much easier than the other types.
This problem has implications for the global carbon cycle. These carbon particles have been released from permafrost on land and transported for hundreds of kilometres offshore, a trip that has taken thousands of years. If all of the carbonaceous material can survive the journey, it means that this fraction of the organic matter is not at risk of being degraded and released to the atmosphere as greenhouse gases. Burying it in the ocean provides protection from degradation for thousands or millions of years. Future studies should look at just how well the carbon particles can survive erosion and burial.
In summary, carbonaceous material is resilient to degradation and can be used to trace sediment sources across the Arctic shelf.
Update: The paper is now published and can be downloaded from the journal webpage.
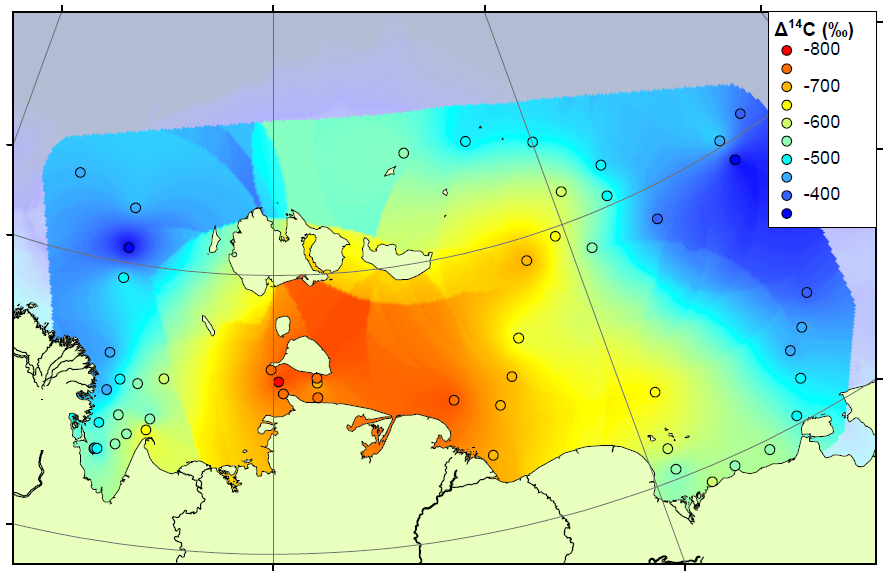
Map of radiocarbon ages across the ESAS
The study continues our work on the East Siberian Arctic Shelf, and contains two new datasets. The first is a radiocarbon study, measuring the age of organic matter on the shelf using carbon dating (see map above). By measuring the age, we can determine whether the carbon has come from the ocean (very young), the topsoil (quite young) or the coastal permafrost (thousands of years old). We combined our results with those already measured on the shelf to form the most complete radiocarbon map for this area. The high-resolution map shows that areas close to the shore and away from the major rivers are home to very old carbon, almost certainly sourced by erosion of old permafrost cliffs. Elsewhere on the shelf, the carbon is younger but not as young as modern topsoils or ocean carbon. Therefore the coastal erosion carbon is having an influence right across the shelf.
A pyrolysis probe can heat samples to 900 C in milliseconds
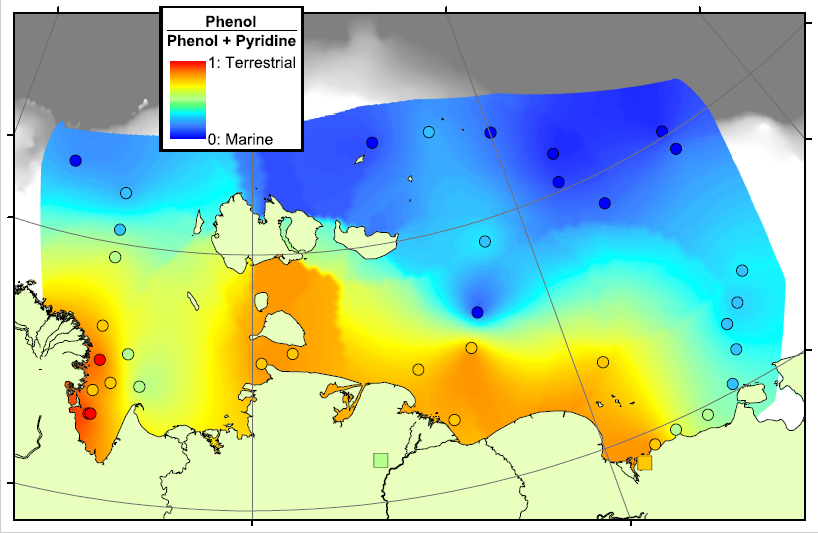
Our second technique is pyrolysis GCMS, where samples are smashed into small pieces using high temperatures and the small pieces are then analysed using GCMS. This technique generates a large amount of small pieces, too many to analyse each one individually, and so we decided to concentrate our efforts on a few target molecules. These included Phenols, which are probably sourced from lignin, a major component of land plants, and Pyridines, which are nitrogen-containing compounds probably sourced from proteins. We think that a lot of the Pyridines in the Arctic Ocean will come from organisms living in the ocean itself, and therefore the Pyridines are a potential tracer for marine organic matter. By comparing the concentrations of Phenols and Pyridines, we can estimate the amount of terrestrial and marine organic carbon in a sample.
Phenol-Pyridine ratio on the Arctic Shelf
In the map above, red areas are dominated by Phenols and are therefore rich in terrestrial carbon, blue areas are dominated by Pyridines and are therefore rich in marine carbon. This pattern matches very well with our previous work in the region, showing that there is a transition from terrestrial to marine conditions across the Arctic Shelf, and that the transition zone lasts for hundreds of kilometres offshore. This means that there is a lot of terrestrial carbon being deposited, and hopefully buried, on the shelf, rather than all of the eroded carbon being degraded and released as CO2.
06/09/2016 UPDATE: The paper has been accepted and is now published. The final version is available from the journal.
Our international team of East Siberian researchers currently has a paper in open review at Biogeosciences. The discussion paper, and its interactive comments, can be downloaded from the journal website.
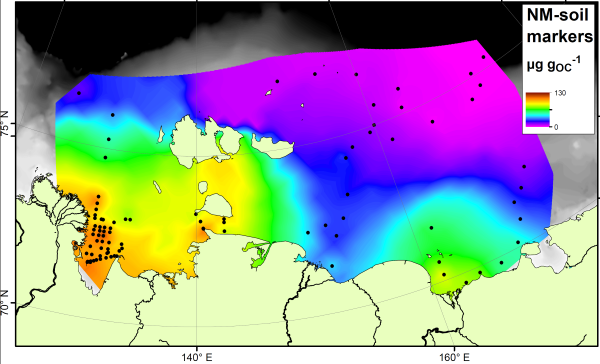
The paper studies a group of compounds called “bacteriohopanepolyols” (BHPs for short), which are found in the cell membranes of a range of microbes and are therefore one of the most common organic compounds around. They are found in modern and ancient sediments from all over the world. This study has concentrated on two groups of these. Group 1 is the soil marker compounds. These are only found in soils, and so have been used as tracers for soil material in rivers, lakes and offshore. Here is how they are spread across the East Siberian Artic Shelf:
Soil marker compounds across the Arctic Shelf
Note how the soil marker concentrations are highest (orange colours) near to the rivers and coastlines. By measuring the concentration next to the river mouths, and in the sediments being washed away by coastal erosion, we show that it is not just rivers that are delivering the soil markers to the Arctic Ocean.
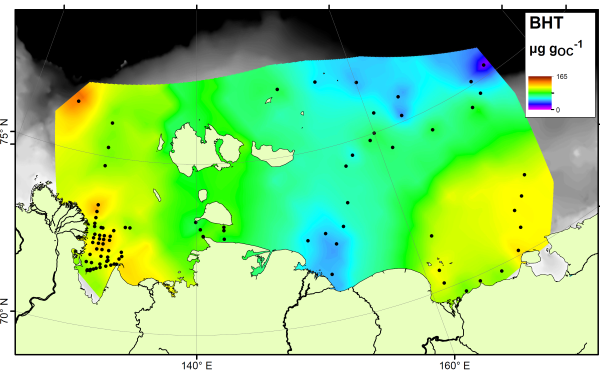
There is no single compound that is a true tracer for carbon produced in the ocean itself, but the compound bacteriohopanetetrol (BHT) is most abundant in marine settings despite being found in soils as well. Therefore if your sample is rich in BHT, and poor in soil markers, it is likely dominated by carbon from the ocean. Here’s a map of BHT across the East Siberian Arctic Shelf:
BHT, a marine marker, is present across the Arctic Shelf
The BHT results show a fairly constant amount across the ocean floor. If we compare the soil marker concentrations to the BHT concentrations, we can see which areas are rich in soil carbon (more soil markers than BHT) and which are rich in marine carbon (more BHT than soil markers). This comparison is called the R’soil index, and is shown below:
R’soil index on the Arctic Shelf
The R’soil index shows that all along the East Siberian Arctic coastline, offshore sediments are dominated by carbon from the land. As you go further offshore, especially in eastern parts nearer to the Pacific Ocean, marine carbon is more important. This result shows a similar pattern to that seen using stable carbon isotopes, but is different to the pattern shown by the BIT index. Therefore these two indices, both based on microbial biomarkers, are tracing different parts of the carbon cycle.
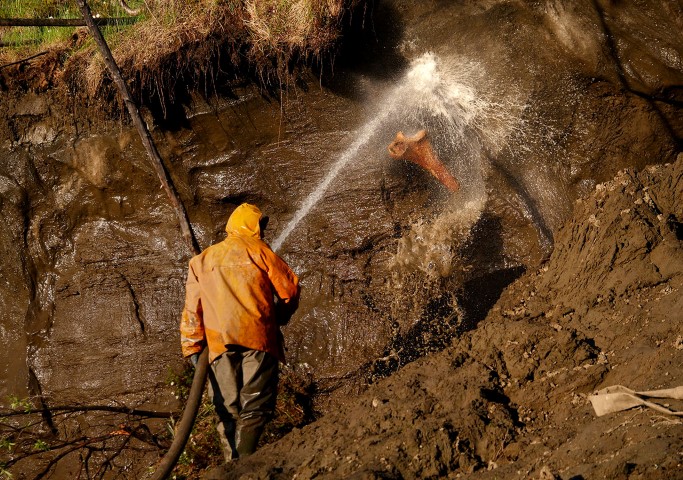
The Guardian newspaper today reported on an interesting set of photographs today documenting one side effect of warming permafrost. Photographer Amos Chapple travelled to the East Siberian region to mine prehistoric ivory from permafrost. Locals had discovered tusks emerging from the river bank as rising temperatures coupled with erosion to uncover bones and tusks that had been buried for thousands of years.
A tusker excavates a prehistoric bone. Photo by Amos Chapple / RFE/RL
The photographs are well worth a look, documenting the extreme (and extremely dangerous) lengths that the ivory miners (“tuskers”) will go in order to find ivory worth tens of thousands of dollars per piece. They carve caverns into the permafrost using high pressure hoses, leaving behind a pock-marked hillside and a river full of debris.
A successful find will net more than $50 000 in cash, and the carved products will be sold for millions, likely in China. While the payback for the few who strike lucky can be life changing, the damage to the local ecosystem, and the likely increase in permafrost degradation and carbon release due to this activity, means that the long-term regional and global consequences will far outweigh the local gain.
This paper was published in the open access journal Earth Surface Dynamics, and is available through the journal website and the MMU e-space repository.
The paper is a combined effort from a large team of researchers interested in the way that organic carbon is exported from small tropical islands. These islands are very biologically productive, the forest grows quickly in the warm, wet climate. They are also responsible for delivering large amounts of sediment to the ocean. Rocks are weakened by earthquakes and then eroded by the frequent tropical storms that hit the islands. This washes sediment and carbon out to sea via two mechanisms. High sediment concentrations lead to ‘hyperpycnal’ plumes of material flowing along the ocean floor, lower sediment concentrations cause ‘hypopycnal’ flows that stay at the ocean surface. Both systems can spread sediments and carbon a long way offshore.
Marine sediment cores look very similar to the sediment coming out of the rivers
It had long been thought that hyperpycnal delivery of sediment, which usually only occurs in the most extreme weather conditions when floods deliver vast amounts of sediment to the ocean in a short period of time, were efficient methods of organic carbon preservation. Our data confirmed this hypothesis, showing that little terrestrial organic carbon was lost during transport, and little marine carbon added to the mixture.
However, the dataset also investigated how efficient hypopycnal delivery can be. Sediment and carbon are delivered throughout the year, in smaller floods and less extreme storms, and it had been suspected that this mechanism exposed the carbon to oxidising conditions where it could be degraded and released as CO2. We showed that in Taiwan, where hypopycnal conditions exist but are still receiving and accumulating a large amount of sediment, the burial efficiency of carbon in hypopycnal conditions is still very high. Marine carbon is mixed into the sediments, but at least 70% of the terrestrial carbon survives.
This means that small tropical islands are even better at exporting and burying carbon than was previously thought, and therefore better at sequestering atmospheric CO2. We estimated that more than 8 Teragrams (million tonnes) of carbon could be buried each year throughout Oceania.
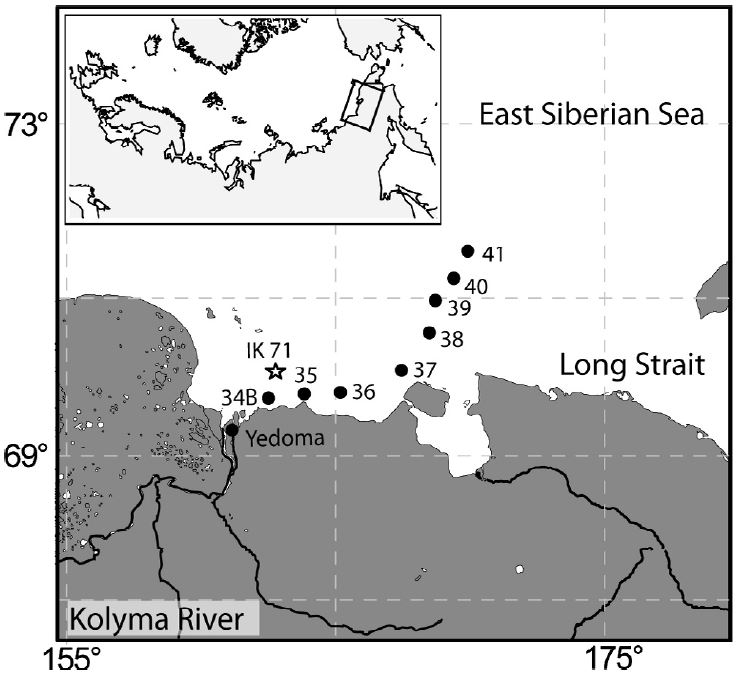
This paper was published in Organic Geochemistry, and is available open-access through the journal website and the MMU e-space repository. In the paper we take a detailed look at lipid biomarkers along a transect from the Kolyma River to the Arctic Ocean.
The data used in this paper is a subset of the data from across the East Siberian Artic Shelf (ESAS) published shortly afterwards in Biogeosciences. In this paper we took a closer look at the offshore trends seen in material delivered to the ocean by the Kolyma River, the easternmost of the Great Russian Arctic Rivers. The Kolyma River catchment is entirely underlain by continuous permafrost, which makes this are an extreme endmember in terms of permafrost systems. The main sources of organic matter from the Kolyma region are river erosion, mostly from top few metres of soil, the active layer that freezes and thaws each year, and coastal erosion from the “yedoma” cliffs along the shoreline.
Sample locations for the Kolyma River – ESAS transect
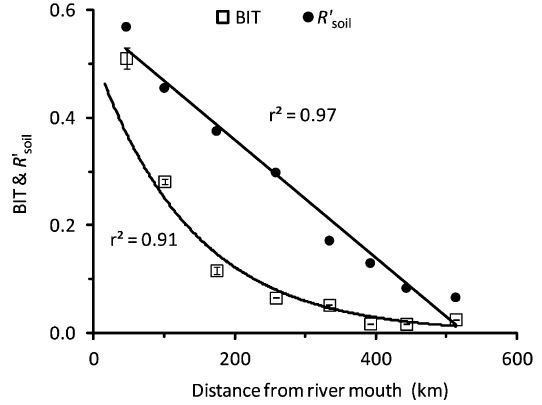
These samples had previously been analysed for bulk properties (total organic carbon content, carbon isotope ratios) and some basic biomarker measurements, but we added complex lipid analyses to the story. We measured both GDGT and BHP lipids, these are found in microbes and can be analysed using LCMS. Amongst the many applications of these lipids, they can be used to trace the amount of soil found in offshore sediments. Each group of molecules has an index associated with it: GDGTs are used in the BIT index and BHPs are used in the R’soil index. Values of 0 would have no soil input and 100% marine carbon, while values towards 1 would be dominated by soil.
Offshore trends in the BIT and R’soil indices
Usually these indices show the same offshore trends, which would be expected since they are both supposed to be tracing the same number – the proportion of carbon coming from soil. However, as the figure above illustrates, the two indicies have very different patterns from the river mouth (0 km) across the shelf (500 km). The BIT index drops quickly offshore, making a curved offshore profile, but the R’soil index forms a straight line offshore. Therefore two different techniques, supposedly measuring the same thing, don’t show the same results.
We think that this is due to the source of lipids used to make each index. Branched GDGTs (from soils) are common in sediments close to the river mouth, but their concentration drops quickly offshore. Marine GDGT concentrations increase across the shelf and this combination causes the BIT index to decrease rapidly. Branched GDGT concentrations in soils and lakes on land are high, but they are very rare in the coastal permafrost cliffs. Therefore any coastal erosion is not really affecting the BIT index.
On the other hand, soil marker BHP molecules are found in river sediment and coastal permafrost, and so there are two terrestrial sources. The concentration of soil marker BHPs drops much slower offshore than for the GDGTs. Also different, the concentration of the marine BHP marker doesn’t increase offshore. This combination means that the R’soil index drops much slower than the BIT index.
In the end, what this paper mainly shows is that when using biomarkers as proxy measurements for something else one single result is probably not enough. Proxy measurements are valuable tools, but they depend on measuring one thing to discover another. Combining multiple proxies together adds value and reliability to a study, either by confirming a hypothesis or bringing new insights.
This paper, with Jens Turowski and Bob Hilton, was recently published as an open-access article in Geology and is available from the journal website and via the MMU e-space repository. In it we show that erosion and transport of large woody material (coarse particulate organic carbon; CPOC) is very important in terms of the overall carbon cycle, but is concentrated in very extreme events.
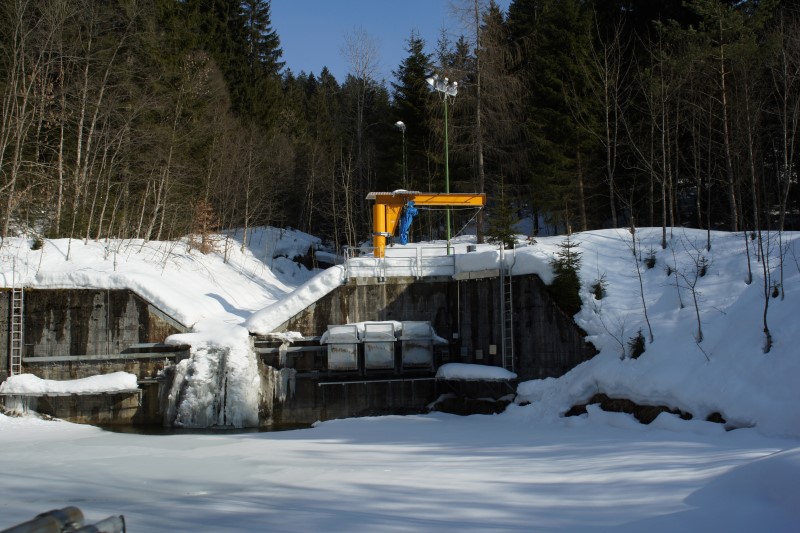
The research is based in the Erlenbach, a small river in the Alps that has been studied by Swiss researchers for several years. They have built a very sophisticated stream sampling station, which can capture everything that flows down past a gauging station. There is a large retention pond that catches the logs/pebbles/sediments and a shopping-trolley sized wire basket that can be moved into the middle of the stream to catch a particular time point (for example the middle of a large storm). The photo below was taken during winter when the river was frozen over, but you can see the v-shaped river channel, the three wire baskets ready to move into position to catch material, and the snow in the foreground covering the retention pond.
The sampling system in the Erlenbach River during winter
This sampling system led to Jens observing that there was a lot of CPOC coming down the river and piling up in the retention pond. A quick calculation suggested that this was a significant portion of the total carbon coming out of the river catchment, but the scientific consensus was that actually more carbon came through as fine particles than CPOC. An experiment was designed to test this.
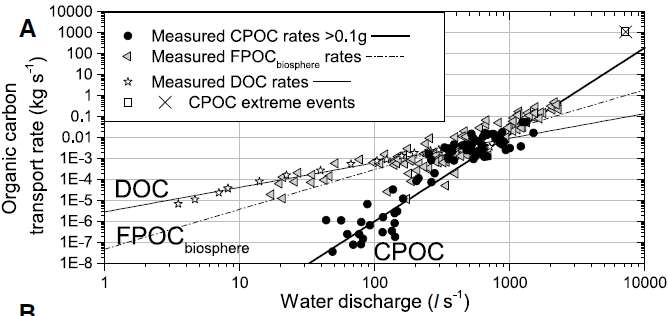
Across a wide range of river flow speeds, the amount and size of woody debris flowing down the river was measured, both waterlogged and dry material. This allowed a rating curve to be defined – that is for a given river flow speed, how much organic carbon would be expected to flow down the river? The rating curve was very biased towards the high-flow end for CPOC, much more so than for fine carbon (FPOC) or dissolved carbon (DOC). At low flow rates, very little CPOC is moved, but at high flow rates a very large amount is mobilised.
Rating curve of organic carbon types vs. river discharge
During the 31 years of data collection there were four particularly large storms. Integrating over the rating curve shows two things. Firstly, if the large storms are ignored then the Erlenbach is already a major source of CPOC, about 35% of the total carbon, with CPOC being roughly equal to the FPOC estimate. Thus it is much more important than might previously have been imagined. If the extreme events are included, the CPOC becomes ~80% of the total organic carbon transported by the river.
A majority of the CPOC transported by the river was waterlogged, having sat on the river bank or behind a log jam while waiting for a large storm to wash it downstream. Waterlogging increases the density of the wood and makes it more likely to sink when it reaches a lake or the sea. My contribution to the paper was to provide evidence of this process. My PhD work in the Italian Apennines found CPOC, from millimetre scale up to large tree trunks, that had been preserved in ocean sediments for millions of years. Again, a lot of this CPOC is too large to measure using standard techniques, and suggests that rivers can deliver organic carbon from mountains to the ocean far more efficiently than previously thought.