GDGT distributions on the East Siberian Arctic Shelf: Discussion paper

My last post talked about Open Access publishing, and the various philosophies for spreading (and/or making money from) academic knowledge. Now there is a chance to play an active part in the publishing process. My latest paper has been submitted to a journal called “Biogeosciences” which is administered by the European Geosciences Union (EGU). Their journals are published using a super open process, where more than just the final paper is released free-of-charge to the world. Whereas in regular Open Access publishing anyone is free to read the final reviewed work, in EGU journals the initial version is also made available. Two reviewers are selected from the community, and their reviews are shown on the website as well. Everyone else is free to read and comment on the paper, raising questions that the authors have to respond to. It is hoped that this system is a) transparent b) open to more (constructive) criticism than the standard two-review system and c) faster, since the paper is available for people to read at an earlier stage of the process.

A figure from the paper showing land-sourced GDGT molecules

Our paper discusses the distribution of GDGT biomarkers on the East Siberian Arctic Shelf. We measured these biomarkers to determine whether the organic matter deposited on the shelf came from land or ocean sources. When we had made these measurements, a model was created to try and explain the observations and work out the budget for carbon being delivered to the shelf from large Arctic rivers.

If you want to read and comment on the paper it is available on the Biogeosciences website

What is: Open Access publishing?

Peer review is generally accepted to be the least-worst way to generate trust in the scientific publishing process. By allowing experts in the field to read, critique, confirm, challenge and improve your work before it enters the mainstream body of science, poor quality or erroneous work should be filtered out before it gets the chance to distort public perception and policy. However, it’s not without its critics. Anonymous reviews allow reviewers to partake in spiteful and/or personal attacks which do nothing to improve the science behind the work, and can delay or even prevent publication of perfectly acceptable work. Also, the system is based on a financial system that only seems to benefit the publishing companies. In traditional journals, scientists relinquish their copyright to a company that then charges them and their colleagues to read the work, restricting access to those in universities or with big budgets (individual papers can cost $30 or more, subscriptions run to the thousands). Journal reviewers and editors work for free, considering the process as part of their community obligation despite the for-profit journal getting the real benefits.

Recently, open-access publishing has started to change the way that ordinary people can read the research that they, through their taxes and charity donations, have paid for, but the business model for the publishers is generally similar. In a typical open access publishing workflow, the researchers submitting the paper pay an “article processing charge” (APC) once the work has been accepted. Paying this charge, which is often £1000 or more, allows them to retain the copyright, and lets anyone, anywhere in the world, read the paper for free. It shifts the costs for access from the distributed consumers, who would often lack the resources to pay for the research, to the universities producing the work in the first place. Most research grant bodies now request open access publishing, and have provided some funds to cover the APCs, for now at least. Reviewers and editors are still unpaid, and publishers still make a profit, in fact since many articles are not open access then universities (i.e. taxpayers) are on the hook for both the journal subscriptions and the APCs.

So why are researchers still paying these companies such large amounts of money (profit margins are amongst the best of any industry)? Well, academic promotion is mostly decided by your publication history; the easiest way to judge a publication history is to look at the journals that a researcher publishes in, rather than reading the papers themselves. Therefore the pressure is on, especially for young researchers, to publish in the most prestigious journals, and they tend to be the most expensive ones, where articles are either restricted access or have high APCs.

Recently, there has been a shift towards more open and accountable publishing systems, with journals allowing researchers to publish either draft versions or even the finished paper on their website without violating copyright. Many universities have created online repositories to let researchers store and share their work (mine is available through my Manchester profile page), which are imperfect, since it’s often hard to find the papers, but better than nothing.

Even within my short career, the way that people publish and access science has changed; open publishing is still in development and it’s likely that further innovation in the next 5-10 years will change the landscape even further.

Canadian permafrost as a source of easily-degraded organic carbon

The February issue of “Organic Geochemistry” will include a paper by David Grewer and colleagues from the University of Toronto and Queen’s University, Canada which investigates what happens to organic carbon in the Canadian High Arctic when the surface permafrost layer slips and erodes. This is a paper that I was involved in, not as a researcher but as a reviewer, helping to make sure that published scientific research is novel, clear and correct.

Map of Cape Bounty in the Canadian High Arctic

The researchers visited a study site in Cape Bounty, Nunavut, to study a process known as Permafrost Active Layer Detachments (ALDs). The permafrost active layer is the top part of the soil, the metre or so that thaws and re-freezes each year. ALDs are erosion events where the thawed top layer is transported down the hillslope and towards the river. Rivers can then erode and transport the activated material downstream towards the sea.

The team used organic geochemistry and nuclear magnetic resonance spectroscopy to find out which chemicals were present in the river above and below the ALDs. The found that the sediment eroded from the ALDs contains carbon that is easily degraded and can break down in the river, releasing CO2 to the atmosphere and providing food for bacteria and other micro-organisms in the water.

Arctic sea ice over one year

As 2014 draws to a close, what were the key features of the Arctic climate this year? Today let’s look at the sea ice coverage. The US National Snow and Ice Data Centre has a monthly running commentary on ice cover on their website, and in general 2014 has been “extremely ordinary”, by which they mean that sea ice grew and shrank at roughly the rates of the last few years. Ice cover was not as low as 2012, the record-breaking year for sea ice retreat, instead it was pretty average for recent times. Remember that this is still way down on the long-term average.

Monthly Arctic sea ice cover for the last few years (NSIDC)

Using their monthly data, here is an animation of the sea ice changes over the last 12 months. It’s a reminder of just how dynamic the Arctic is. Sea ice cover is important for a number of reasons. First of all, the white colour reflects sunlight that shines onto the ice surface during the summer. Reflecting sunlight back into space means that it does not stay around to warm our planet, so having a decent covering of ice helps to regulate temperatures. As the summer sea ice cover has decreased in recent years, the amount of sunlight reflected back into space has decreased, meaning that there is a positive temperature feedback at work here.

animsm
Arctic sea ice cover over the last year

Sea ice cover is also important for the Arctic Ocean’s biological cycle. Many plankton require sunlight for photosynthesis, so the retreat of sea ice during the spring and summer causes a bloom in biological productivity in the surface ocean which feeds down the food chain, supporting large numbers of fish and whales. As organic geochemists, we can see this plankton bloom by looking in the ocean sediments biomarkers. There are specific chemicals that are produced by marine organisms that can be used to track the productivity, and it seems that there is a direct link between the ice-free areas and the highest amount of biological activity.

Manchester Museum – Siberia Exhibition

Starting this Saturday 4th October, and lasting until 1st March, the Manchester Museum will be holding a special exhibition on Siberia. This will contain a collection of special items from British and Russian museums, including a mummified baby mammoth and a brown bear, along with displays on the culture and natural history of the region, taking visitors beyond the stereotypical view of Siberia as an icy wasteland. Along with colleagues in Manchester, Newcastle and London, I have made a display board and video about Siberian climate change, which will be showing throughout the exhibition. More to follow once the exhibition opens…

Official Museum Poster

US Government review of climate change

This week the US government released their own review of the climate, including the current state of play and predictions for the future. They conclude that climate change is happening now, affecting lives today, and not just something to worry about 20+ years in the future.


Modelled temperatures with and without human CO2 emissions

The report website is very comprehensive and well-written, and I’m not going to reproduce it here. The section on Alaska, complete with interactive photos and charts, is relevant to permafrost research across the whole northern hemisphere.


What Is: GRAR?

Russia is big, really big, and to go with that, it has some very big rivers. The majority of the Russian river outflow is into the Arctic Ocean, especially in the central and eastern parts of the country, and this is generally concentrated into a series of very large rivers. The largest of these are known as the Great Russian Arctic Rivers (GRARs). From west to east, these are the Ob, Yenisety, Lena, Indigirka and Kolyma, of which the Ob and Lena are largest, and Indigirka the smallest (small enough to not count in some people’s list of GRARs).

Catchment areas of the Great Russian Arctic Rivers

The Ob river is the world’s fifth-longest and has the sixth-largest drainage basin, yet has only the 19th highest annual discharge, being overtaken by the smaller Yenisey and Lena rivers to the east of it. All of these river basins contain some permafrosted land, which can reduce discharge during the winter months and have a very large flood-period in late spring / early summer when the meltwater arrives (the “freshet”).

Permafrost within catchments of the GRARs

As the amount and continuity of permafrost increases from west to east, so the proportion of each permafrost type increases within the river basin. The Ob and Yenisey are largely free of continuous permafrost, allowing water to flow through the ground to the bedrock and into the river, whilst the Indigirka and Kolyma are practically 100% continuous permafrost, and thus any water discharging will have run along the top of the ground before entering the river itself. This can have consequences for the type of material, especially carbon, carried by the rivers.

Proportion of each type of permafrost within river basins

This east-west contrast is worth exploring in more detail in a later post, since it shows how Siberia may behave very differently if the permafrost were to thaw. As a final reminder of just how large the rivers are, even the smallest, Indigirka, manages to cover more area than the British Isles! As usual the full-resolution PDFs of the figures from this article can be downloaded here: River catchments no permafrost, Catchments and permafrost, Permafrost chart, Catchments and UK.

Comparing the catchment areas to the British Isles


Infographic

I am in the process of designing an infographic-style poster to explain our work in the Arctic in a few simple charts. Here are some early drafts of introductory slides.

Northern Hemisphere permafrost is only 16% of the global soil area
Yet it represents over half of the global soil organic carbon poo;
Yet it represents over half of the global soil organic carbon pool
Global soils contain more organic carbon than fossil fuels or the atmosphere


State of the climate – a 2013 snapshot

NASA measurements
2013 Temperature Anomaly

In January, NASA and NOAA (the US National Oceanic and Atmospheric Administration) released a joint statement on the temperature and climate patterns seen in 2013. Their short presentation (PDF) gives a summary of last year’s data in relation to long-term trends and averages. Of particular note for Arctic scientists is the relatively cool high-latitude temperatures in mid-summer. These lead to less summer sea-ice melting compared to the previous year’s record-breaking minimum, causing nonsensical headlines from the usual suspects that the world was cooling down. As slides 2,3 and 8 show, 2013 was one of the warmest years on record, while slide 11 shows that Arctic sea ice was still far below average last year.

Polar ice cover graphs
Polar ice cover through time

Public perceptions

A new report from Yale has found that “belief” in climate change among the American public is decreasing, and that now less than half of people believe that climate change is man-made.

So why is this? My personal guess is that we’ve all got a little bit of David Cameron inside us, and when things got tough we decided to “cut the green crap”. Shrinking fincances have led to a more selfish outlook, we just can’t justify spending more on sustainable energy when there are other, more basic, needs to consider. Couple this with a natural desire to believe that whatever bad things happen are not our personal fault, and an increasingly vocal climate skeptic lobby, and it’s understandable that people would want to switch sides.

But wait, burying our heads in the sand is not the answer. Things have changed recently, measurements have been taken and trends have been spotted that, with the right spin on them, would appear to play right into the hands of the global warming deniers, yet the reality is that we should be as concerned as ever about the future of our planet. Recently I have spoken to several well-educated, some extremely well-educated, people who, despite all the coverage are unconvinced that we, you me and 7 billion other human beings, are responsible for the changing climate, or even that it is changing at all. This seems to be a new thing, a few years ago they might have been on the other side of the debate. Has climate skepticism become fashionable?

I’m not about to start presenting all the data and rebuking every argument about climate change, the volume of data is too large and there are so many points to argue about that I don’t have the time. However, lots of other people do have the time:

The latest IPCC report is probably a good start if you want the “official” summary:

http://www.climatechange2013.org/images/uploads/WGI_AR5_SPM_brochure.pdf

A more targeted and less hardcore site goes through the climate skeptic arguments one by one:

http://www.skepticalscience.com/

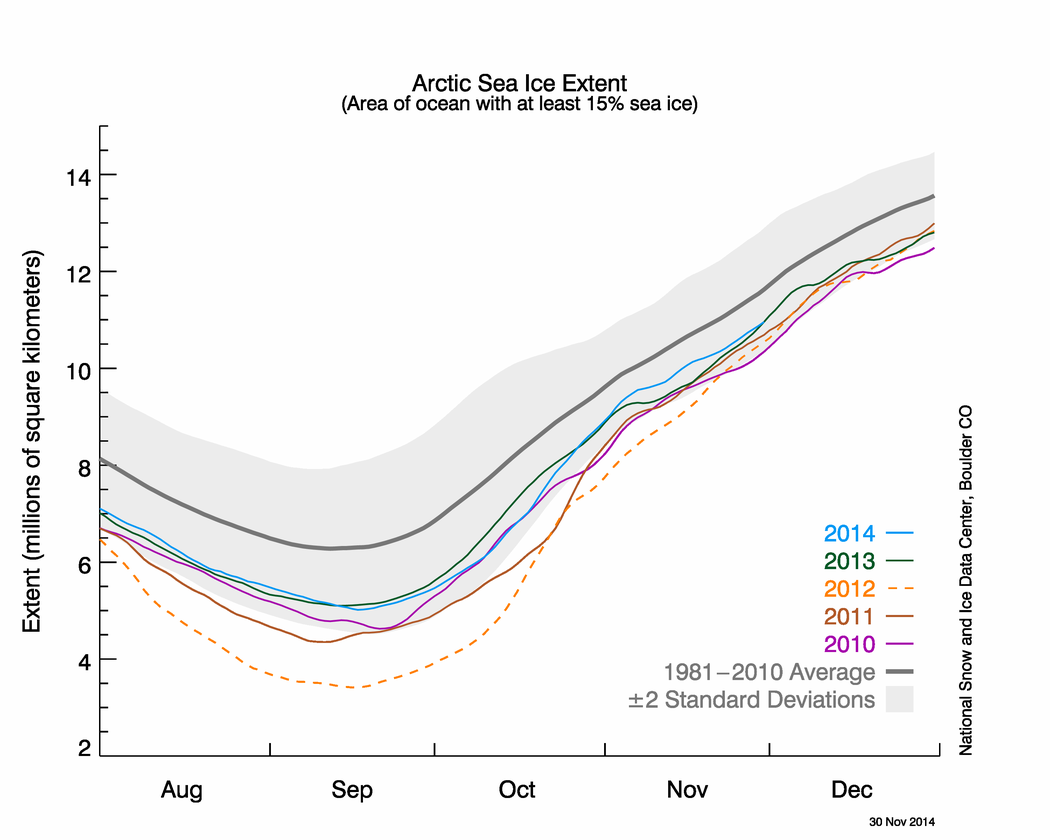
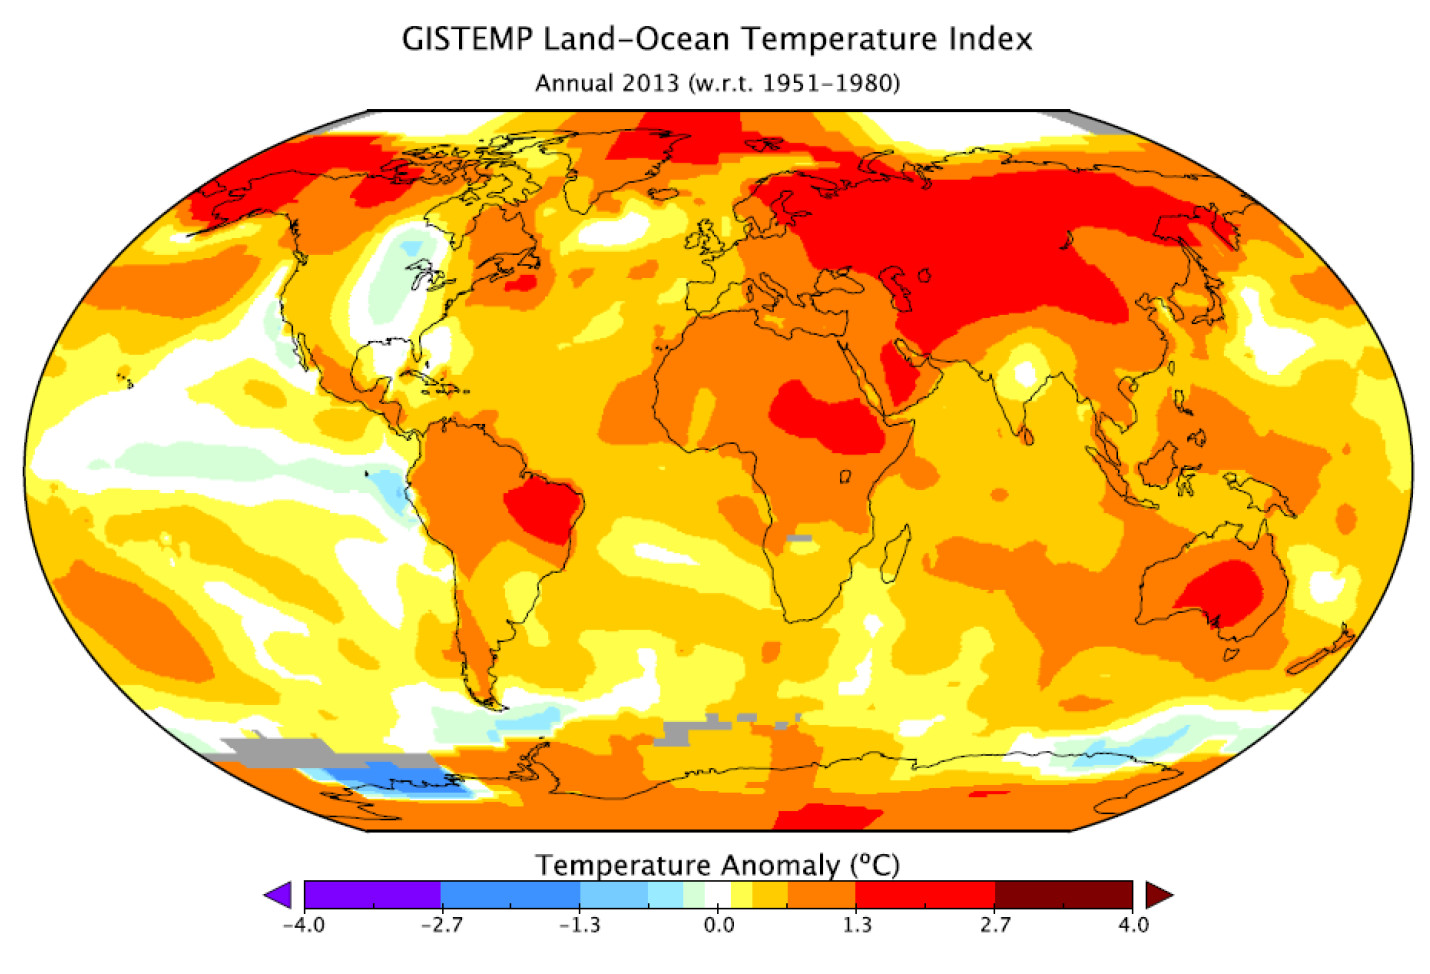
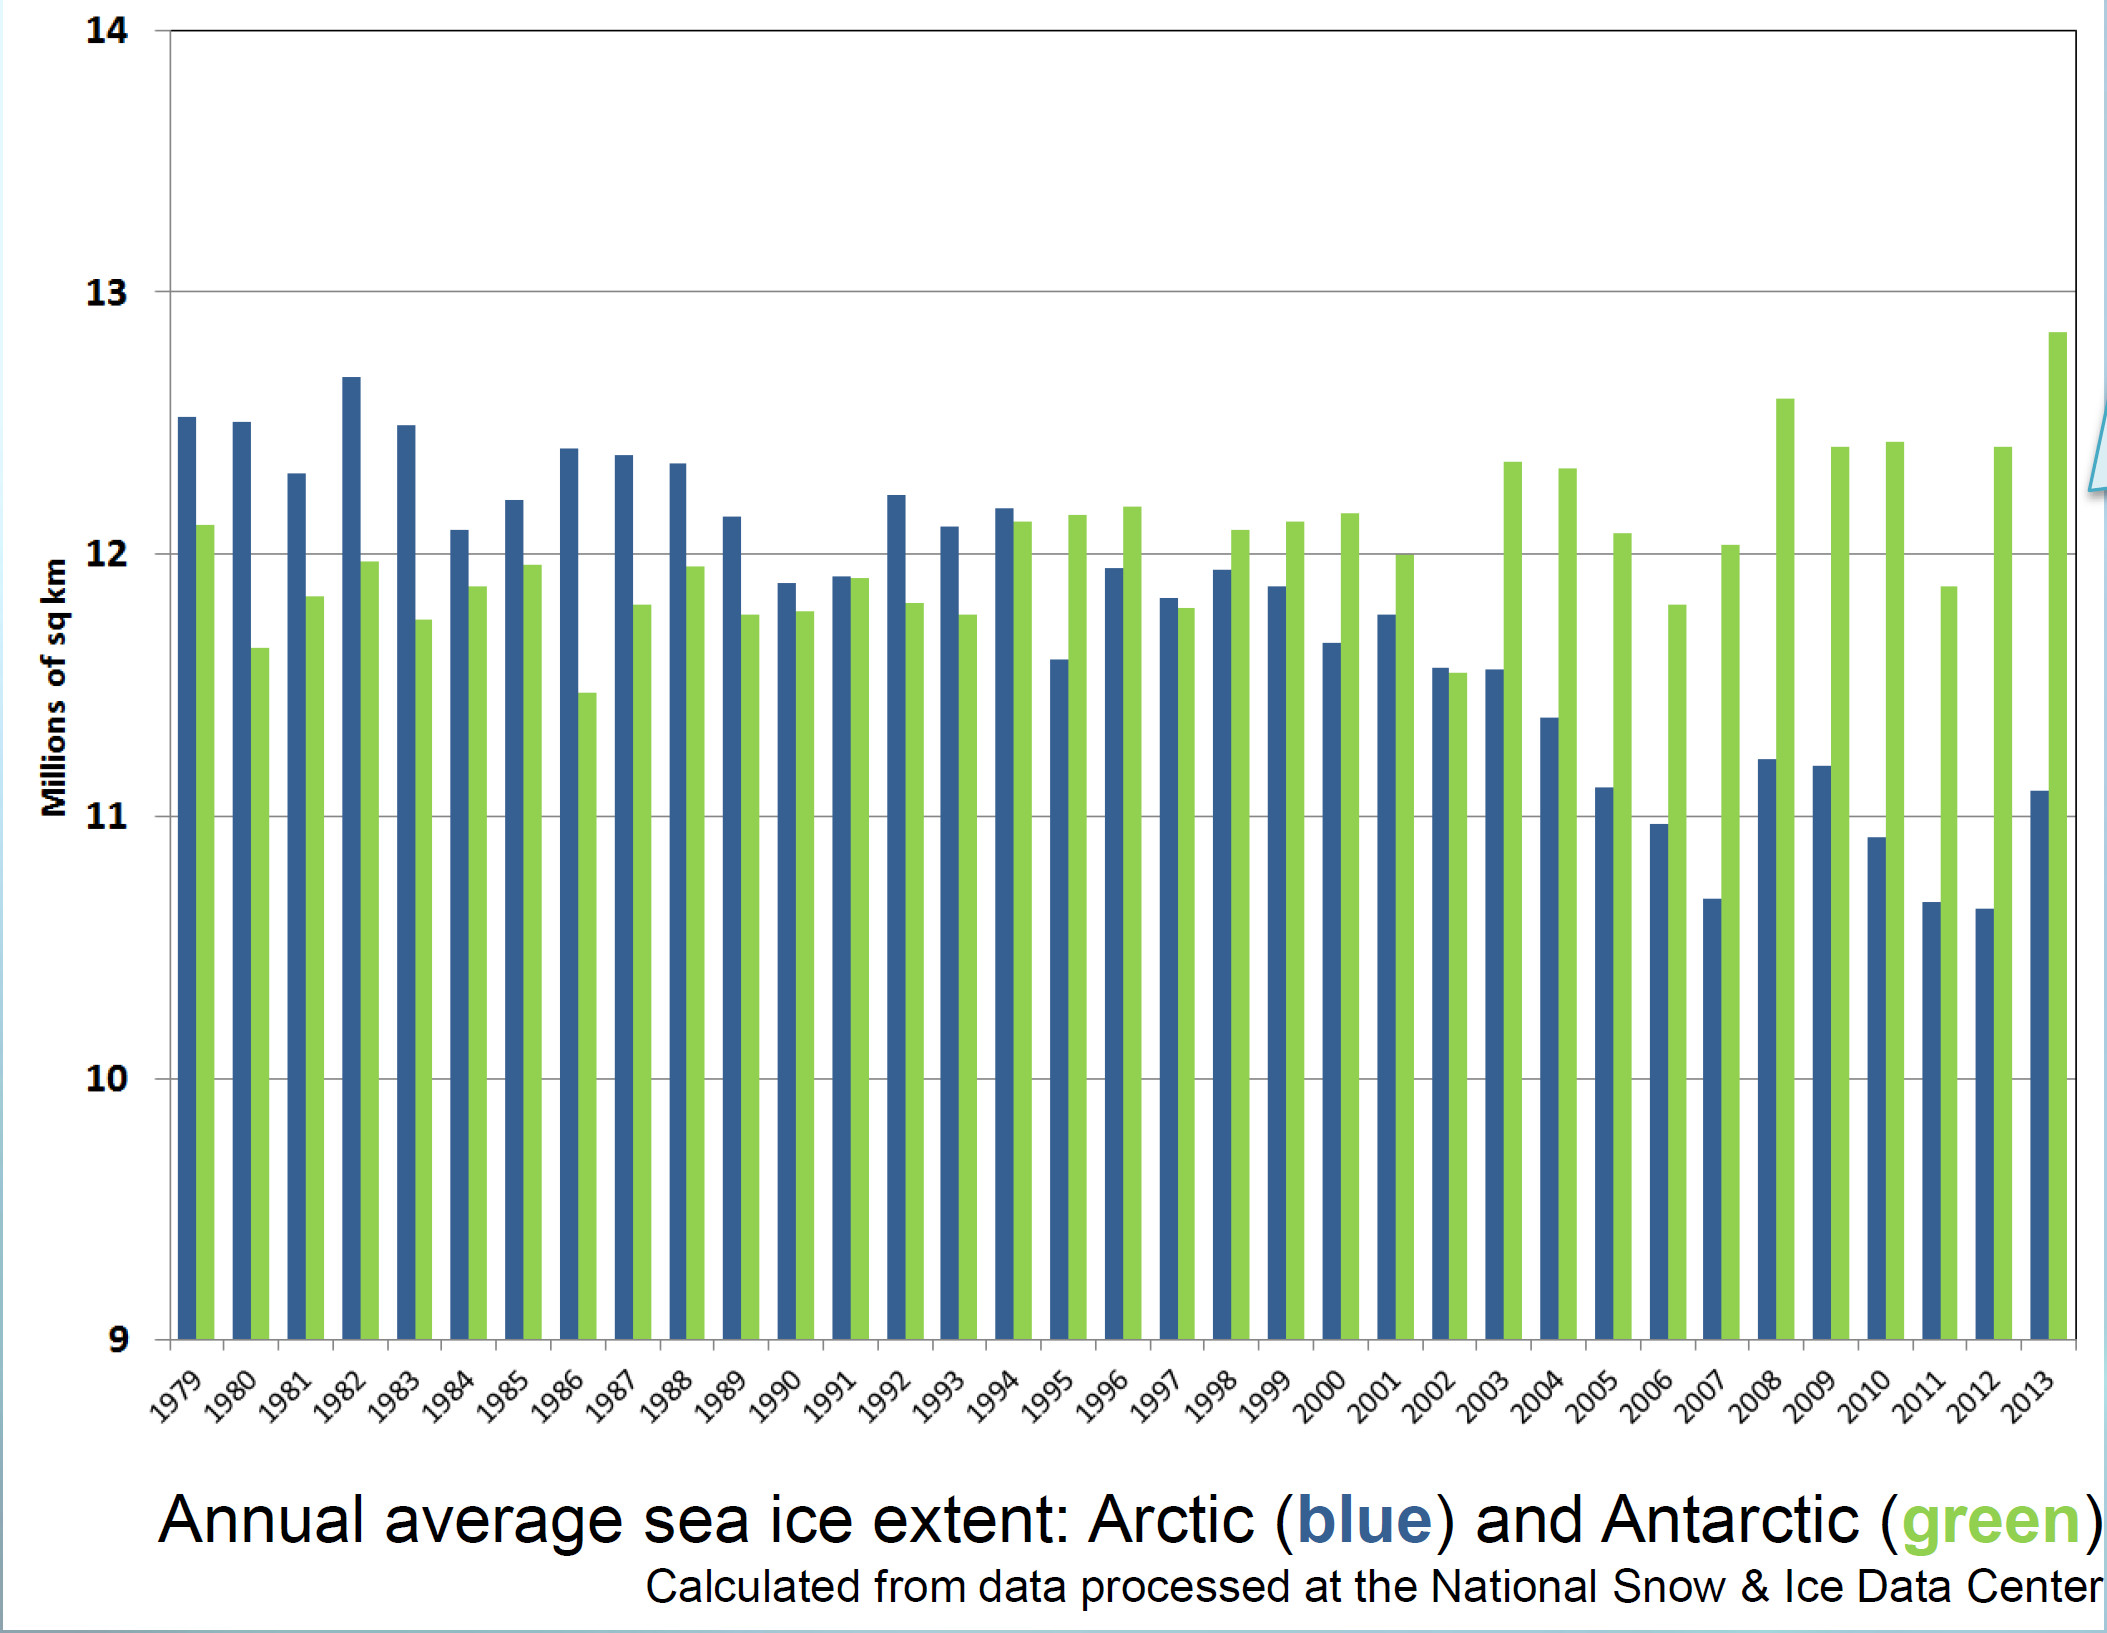
And now for my two-pence worth. It’s mostly an appeal for common sense, from both sides of the argument. Journalists are always keen to get a good story, and people with opinions are always keen to emphasise evidence that they are right. However, our planet is a complex system and a single piece of evidence does not sway things. 2012 was a record-breaking year for ice cap retreat in the Arctic, the summer ice coverage was the lowest ever. This led to a lot of reporting which, justifiably, picked up on this and suggested that it might be a bad thing. But did they go too far? Was one data point enough to justify widespread panic? Probably not, but it was something to bear in mind and consider along with all the other available evidence. Subsequently, since we are not yet in a run-away global warming apocalypse, when 2013 failed to break the record again and was merely in line with other data from the 2000s, the journalists on the other side of the argument got to crow that the world was cooling down again. Now they’re almost certainly wrong in every degree – a quick look at longer-term trends would show that 2013 was still far lower than the average and that ice thickness is reducing quickly – but both scientists and science journalists must beware of crying wolf based on a single year’s data.

Getting people worried about climate change was a good thing, but doomsday prophesies about massive immediate changes that have not been borne out will only lead to disbelief.  Just like the size of the ice cap, public belief in global warming is probably due to a number of nebulous factors and might fluctuate from year to year and we as a scientific community must be sensible about the way in which our concern is projected in the media, concentrating on boring but incontrovertible long-term trends rather than sexy but one-off events. As ever, climate != weather.