Macromolecular organic matter across the East Siberian Arctic Shelf

Update: The paper is now published and can be downloaded from the journal webpage.

Map of radiocarbon ages across the ESAS

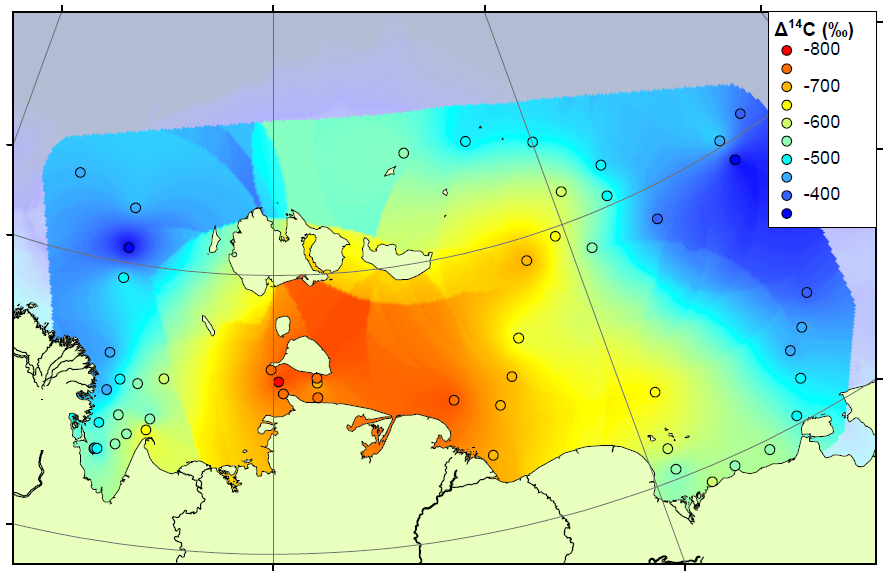
The study continues our work on the East Siberian Arctic Shelf, and contains two new datasets. The first is a radiocarbon study, measuring the age of organic matter on the shelf using carbon dating (see map above). By measuring the age, we can determine whether the carbon has come from the ocean (very young), the topsoil (quite young) or the coastal permafrost (thousands of years old). We combined our results with those already measured on the shelf to form the most complete radiocarbon map for this area. The high-resolution map shows that areas close to the shore and away from the major rivers are home to very old carbon, almost certainly sourced by erosion of old permafrost cliffs. Elsewhere on the shelf, the carbon is younger but not as young as modern topsoils or ocean carbon. Therefore the coastal erosion carbon is having an influence right across the shelf.

A pyrolysis probe can heat samples to 900 C in milliseconds

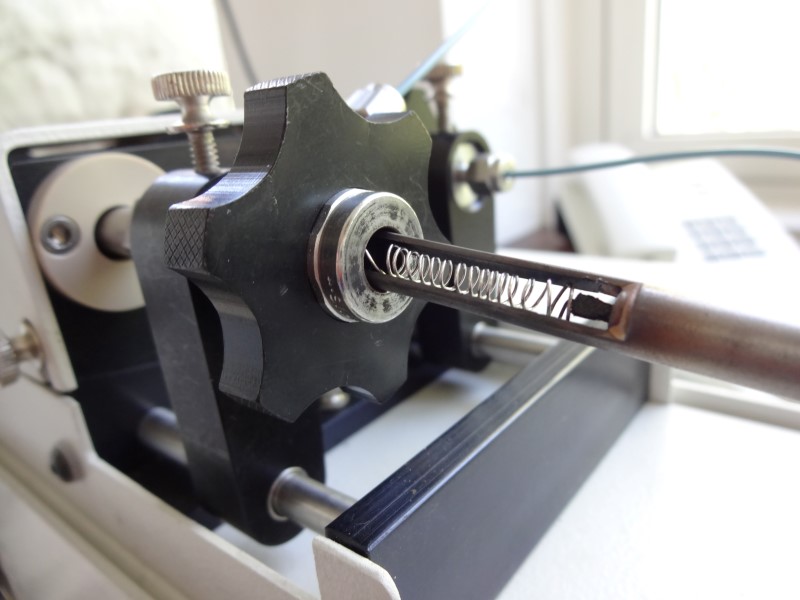
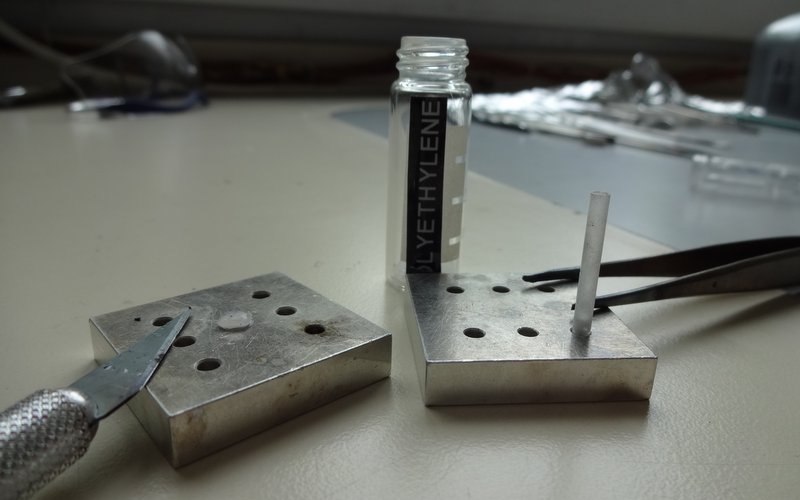
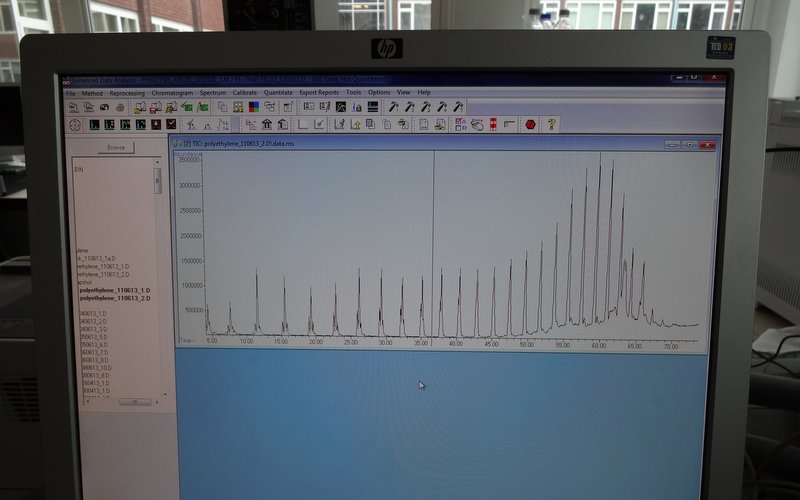
Our second technique is pyrolysis GCMS, where samples are smashed into small pieces using high temperatures and the small pieces are then analysed using GCMS. This technique generates a large amount of small pieces, too many to analyse each one individually, and so we decided to concentrate our efforts on a few target molecules. These included Phenols, which are probably sourced from lignin, a major component of land plants, and Pyridines, which are nitrogen-containing compounds probably sourced from proteins. We think that a lot of the Pyridines in the Arctic Ocean will come from organisms living in the ocean itself, and therefore the Pyridines are a potential tracer for marine organic matter. By comparing the concentrations of Phenols and Pyridines, we can estimate the amount of terrestrial and marine organic carbon in a sample.

Phenol-Pyridine ratio on the Arctic Shelf

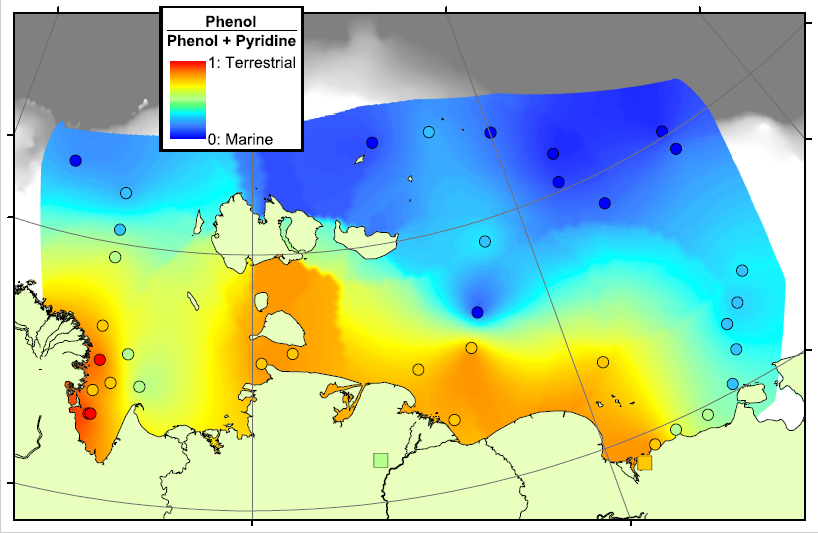
In the map above, red areas are dominated by Phenols and are therefore rich in terrestrial carbon, blue areas are dominated by Pyridines and are therefore rich in marine carbon. This pattern matches very well with our previous work in the region, showing that there is a transition from terrestrial to marine conditions across the Arctic Shelf, and that the transition zone lasts for hundreds of kilometres offshore. This means that there is a lot of terrestrial carbon being deposited, and hopefully buried, on the shelf, rather than all of the eroded carbon being degraded and released as CO2.

The Cryosphere, 10, 2485-2500, 2016
https://doi.org/10.5194/tc-10-2485-2016

Dr Heath-Robinson

Testing in progress
Testing in progress

Sometimes science involves £1 million machinery, exciting state-of-the-art laboratories, expensive and/or explosive chemicals, travel to far-flung exotic lands and schmoozing over canapes. Sometimes it involves retrieving some bits and bobs from a series of dusty drawers and bodging them together into something approximating workable equipment. Today was one of those days. I’ll explain Pyrolysis in a later post, but the aim of today’s work was to create an offline-pyrolysis set-up that can be used to prepare large quantities of sample for analysis later on. The pyrolysis oven itself was already in place, but a regular flow of nitrogen gas is needed to blow through it and transport the chemicals that are released.

Delving around in the back of the lab, we managed to find the inner workings of an old carbon analysis machine sitting in pieces in a drawer. There were flow regulators; lots of copper pipes; a series of connecting nuts and bolts, of which most were incompatible with each other, but some that would play nicely; a couple of glass tubes filled with unknown solids; a pressure sensor; and a piece of steel that once lived inside the machine.

Testing in progress
How it all works

And here we have it! Gas comes from the bottle in the background into the first flow regulator. In an attempt at clarity and sensibility, this is the one on the right hand side, with the “H” dial on, since that’s the only way that the pipework at the back would work properly. At this point the input pressure from the bottle is measured as well, which will hopefully correspond nicely to the pressure measured from the regulator. This first regulator is more of a glorified tap, able to determine roughly how much gas comes through the system but not to accurately control the output rate.

Once the gas has flowed through here, the second flow regulator (on the left) has a much more precise knob (just out of shot above the word “PORTER”) that determines how much gas can flow through the rest of the system. This regulator also has a little floating ball gauge to show the flow rate.

After that, the gas is cleaned in the u-bend. This will remove any liquid from the gas, so that it is nice and dry when it passes onto the samples, hopefully preventing them from reacting with the gas at all.

The last item on this test rig, is the output testing device. A glass of water.

Success! A nice steady flow of bubbles emerging from the system


When it all goes haywire

Sometimes it all seems to go wrong at once – yesterday we needed to replace a gas regulator, replace a broken filament in the Mass Spectrometer, clean several months of dirt from the filament housing, and pump all the air out of the system to make a vacuum again.

The filament in action

The important thing when setting everything up again is to run a standard. This will check that the machine is functioning properly before there is a risk of wasting precious samples in faulty equipment. A standard sample will be simple enough to produce a consistent result, but complex enough to produce more than just one peak in the chromatogram.

Preparing a standard - slice a small piece of PE and insert into a glass tube
Preparing a standard – slice a small piece of PE and insert into a glass tube

We use poly-ethylene  as a pyrolysis standard because the long polymer chains will break into a range of sizes during the heating phase. This produces a nice series of identical peaks, which emerge from the column in the order of their chain length. As long as this run comes out clean, it’s good to go.

A Poly-ethylene Py-GC chromatogram

Perfect – now the GC is up and running again