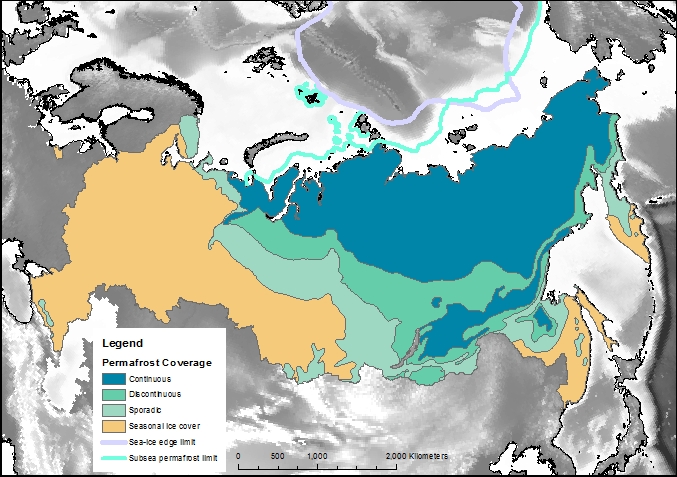
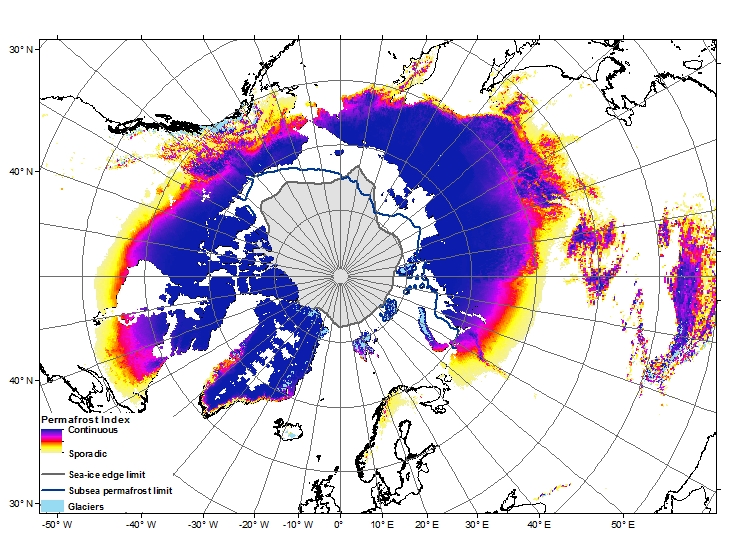
Permafrost covers 24% of the Earth’s northern hemisphere land surface, but how much is that? Well 24% corresponds to 23,000,000 km2. That is a pretty big number, and doesn’t even count the subsea permafrost that covers lots of the Arctic Shelf (see the map above) so here are a few comparisons and measurements in less standard units.
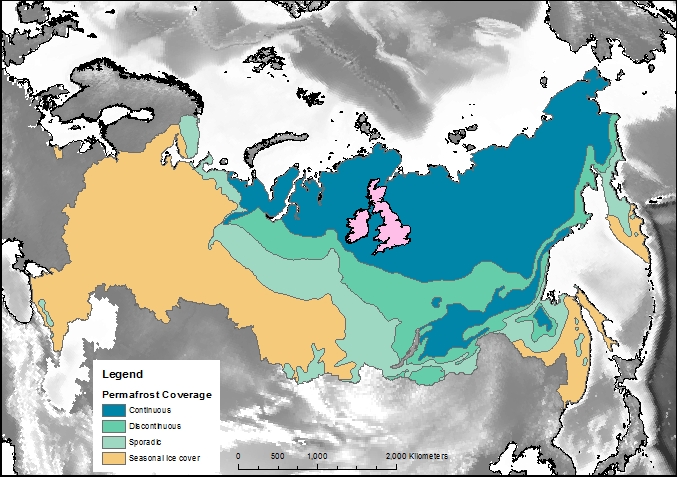
Great Britain compared to the Russian permafrost area.
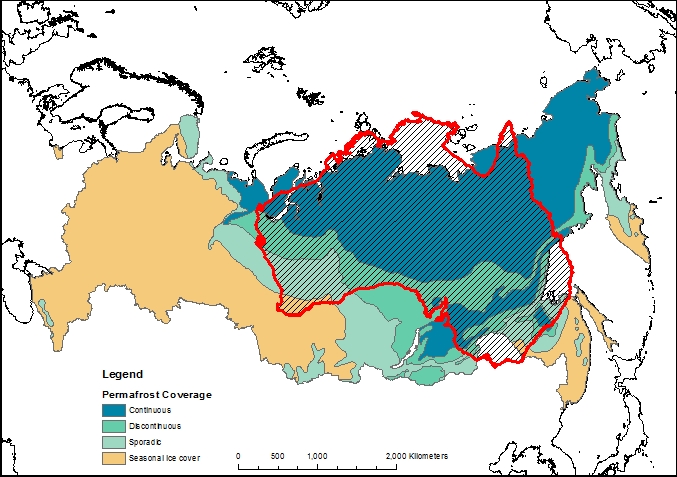
Firstly, let’s compare the permafrost area to some other countries and continents. Here is Britain in comparison, at 243,000 km2 it is almost inconsequential. Only one tenth of the northern hemisphere permafrost. Going up the scale Australia, with an area of 7,700,000 km2, is one third of the northern hemisphere permafrost, and roughly the same size as the 7,400,000 km2 that continuous and discontinuous permafrost represent in Siberia alone.
The land area of Australia compared to the Siberian permafrost
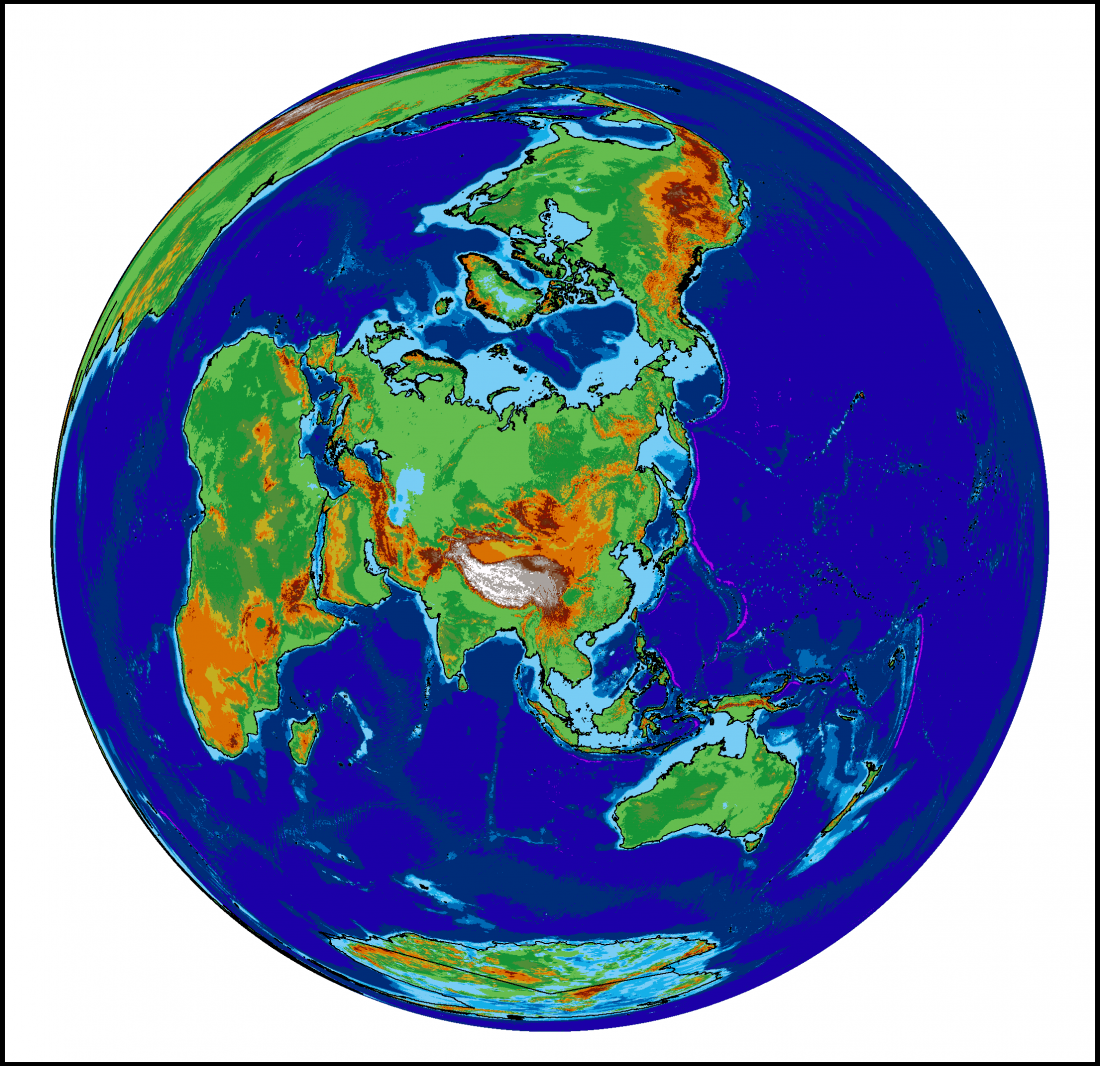
When displaying data near the poles, the choice of map projection is very important. Displaying a 3D object in a 2D screen is always problematic, and involves compromises in either accuracy, practicality or legibility. The standard Mercator projection, as used in the majority of maps seen on a day-to-day basis, stretches the polar regions to infinity. Greenland looks enormous on this map, yet it is actually just smaller than the Democratic Republic of the Congo, and only one quarter of the area of Brazil. To get around this problem, other map projections areavailable.
LAEA projection centred on Siberia – click to enlarge
The projection I have chosen to use for maps of the Siberian permafrost is the Lambert Azimuthal Equal Area map. This projection adjusts shapes and distances in order to preserve the true area of each country. If you look at the full-size version of the map above (click it, or download here) then the view of the Arctic region is relatively consistent with the true layout as viewed from above, but there is an increasing amount of distortion as the distance from Siberia increases.
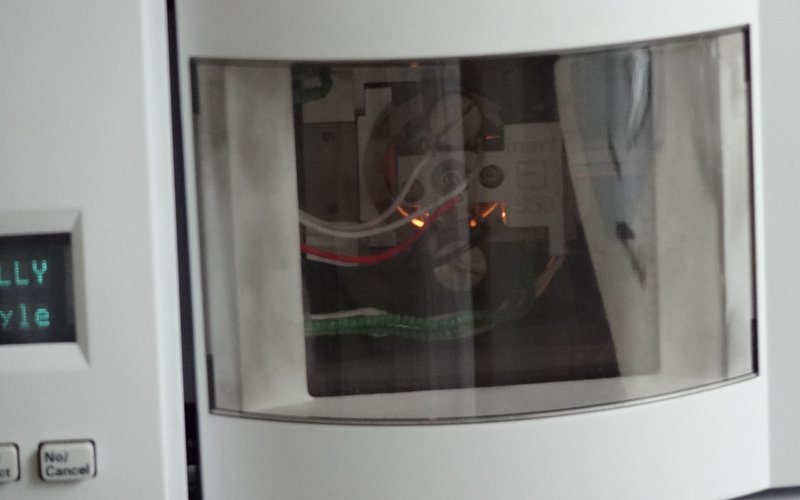
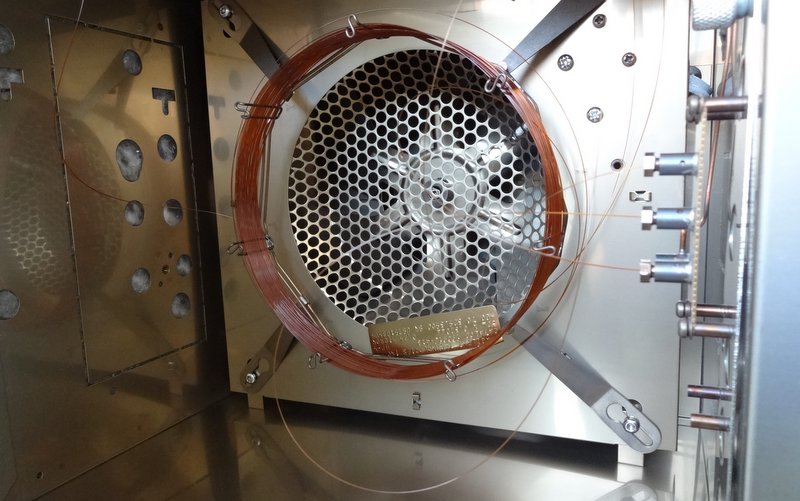
Sometimes it all seems to go wrong at once – yesterday we needed to replace a gas regulator, replace a broken filament in the Mass Spectrometer, clean several months of dirt from the filament housing, and pump all the air out of the system to make a vacuum again.
The filament in action
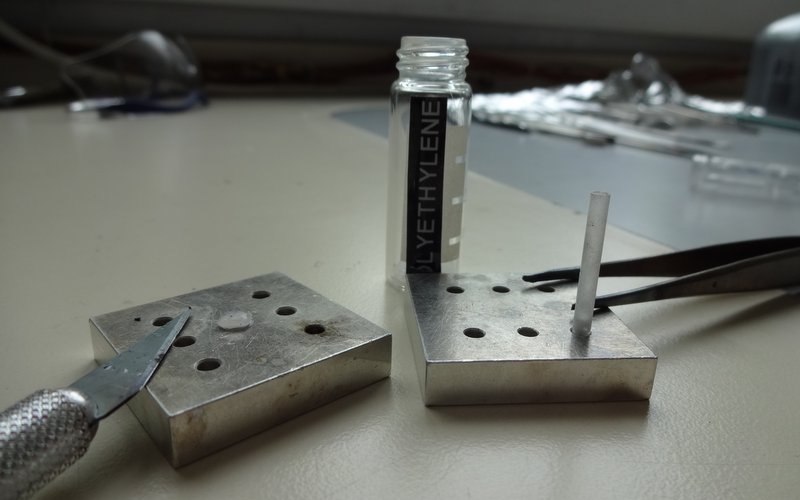
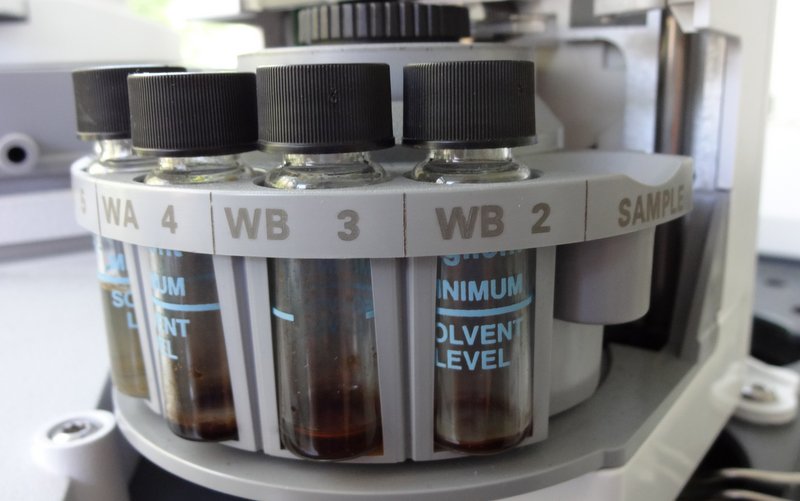
The important thing when setting everything up again is to run a standard. This will check that the machine is functioning properly before there is a risk of wasting precious samples in faulty equipment. A standard sample will be simple enough to produce a consistent result, but complex enough to produce more than just one peak in the chromatogram.
Preparing a standard – slice a small piece of PE and insert into a glass tube
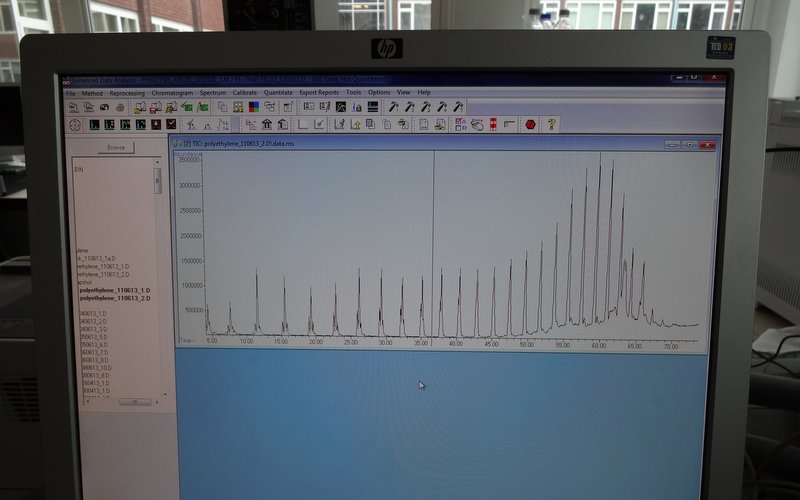
We use poly-ethylene as a pyrolysis standard because the long polymer chains will break into a range of sizes during the heating phase. This produces a nice series of identical peaks, which emerge from the column in the order of their chain length. As long as this run comes out clean, it’s good to go.
Gas Chromatography is the separation of molecules from a mixture using a gaseous carrier medium.
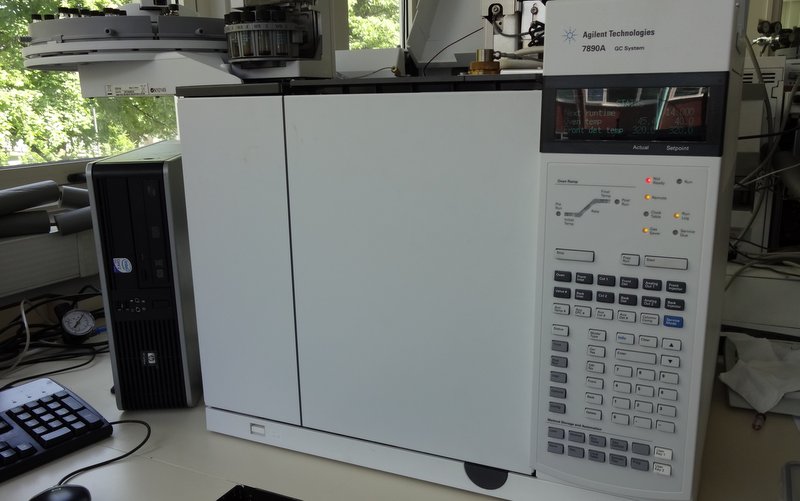
Gas Chromatography allows an organic geochemist to identify and quantify some of the molecules present in a sample. The procedure is similar to Liquid Chromatography (LC), in that a collection of molecules is split into its constituent parts by passing them through a column of material. As the different molecules emerge from the column they are measured by a Flame Ionisation Detector (GC-FID) or identified by a Mass Spectrometer (GC-MS). A GC consists of a sample injector, a column housed within an oven, and an outlet to the detector.
Agilent GC system
The sample injector is responsible for putting a precise amount of sample into the column at the start of the sample run. A syringe is washed in solvent to remove any contamination, and then sucks up-and-down in the sample a few times to mix the sample and make sure there is no air in the syringe. Once the oven is ready for injection, the needle pierces the seal on the top of the GC and injects the sample onto the column. The sample is a liquid at this point, but will evaporate quickly and pass through the column as a gas.
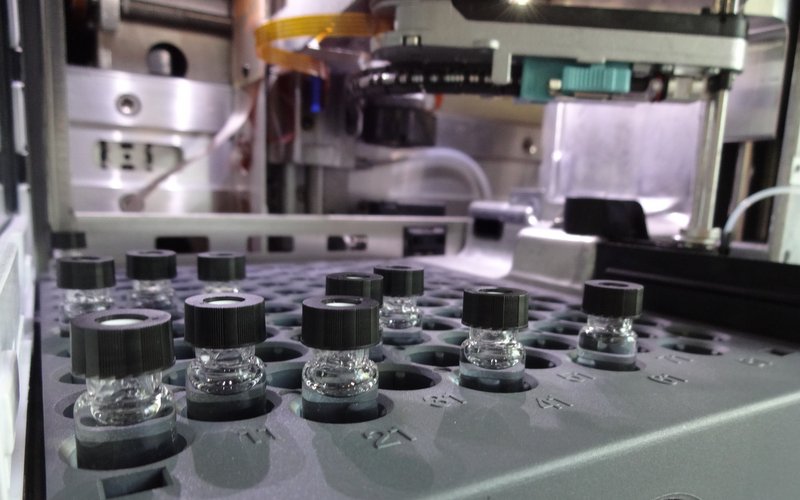
GC autosampler
The column is a 30m coil of glass tubing, just thicker than a hair, which is coated on the inside with an adsorbant material that slows the organic molecules as they pass through. The column is kept inside an oven which is carefully calibrated and can change its temperature during the sample run. In general, smaller, simpler molucules will pass through the column quicker, especially at lower temperature. Molecules will move easier when the temperature is hotter, so the easiest way to separate a mixture of molecules into their constituent parts is to start off at cool temperatures and slowly increase during the run (e.g. 40 to 300 °C over one hour). Simple molecules such as benzene or hexane might pass through the column in 2-3 minutes, whilst large, complex molecules might take up to 45 minutes. The slower the oven temperature increases, the further apart each molecule will be, making it easier to separate each one.
A GC column in the oven
Once the molecules have passed through the column they exit into the detector. This can be a Mass Spectrometer (MS), which identifies the molecule, or a simpler detector that counts the concentration of molecules exiting the column but cannot identify them, such as a Flame Ionisation Detector (FID). Simple detectors, such as the FID, are most useful when the sample is less complex, such as comparing the concentration of a target molecule.
Organic chemistry is the study of materials that contain carbon atoms
Carbon atoms for the basis for all life on Earth. By building molecules out of carbon, hydrogen, oxygen, nitrogen, sulphur, phosphorous and an array of other elements, we can create and regulate our bodies. Organic compounds range from simple methane gas (CH4) up to very long and complex molecules used to protect our cells from toxic environments. Organic chemists work to identify these molecules, learn where they come from an how they are made, discover their function within the cell and investigate their effects on organisms and the environment.
Organic geochemists look at organic molecules within sediments and the rock record. They can use them to identify the source of organic material, looking to see whether carbon present in a sample came from soils, vegetation, marine algae or a range of other sources. Organic molecules can also be used to investigate the decomposition of material, looking to see how it changes over time, to identify the biological processes that were happening in ancient fossils, to identify the source and economic potential of hydrocarbon deposits, and many more applications.
Permafrost is soil or sediment that is permanently below zero °C
When most people talk about permafrost, they think of frozen, empty soil with very little living on it, in it or near it. They think of a harsh, icy environment with glaciers, blizzards and possibly a few reindeer roaming around. But permafrost is much more varied than this. It does not necessarily have a covering of ice, but can be a thin layer of grass or peat with frozen soil underneath it, there can even be forests growing on the surface with frozen soil underneath them. There can be animals living on it, and bacteria living within the sediment. In fact, the permafrost might not even be on land! Here are just a little information about permafrost and what it contains.
Northern Hemisphere Permafrost. Also shown are subsea permafrost and the Arctic ice cap.
Permafrost soils, which are frozen so solid so you need a pneumatic drill to sample them, cover a quarter of the northern hemisphere land area, and can be up to 1500 m thick. They store more carbon than there is in the entire atmosphere. The very top layer will thaw each summer and freeze each winter, which allows plants to grow and animals to graze, but the lower parts remain frozen all the time. In the southern parts, there can be trees growing on top of the permafrost, this is known as the ‘taiga’. When it is too cold, and the growing season is too short, only grass, moss, shrubs and lichen can survive, this is the ‘tundra’.
Another example of permafrost is frozen methane-ice trapped on the seabed. Subsea permafrost is often ignored, but these icy crystals of frozen, flammable gas and water contain a large amount of trapped carbon, are prone to melting and gas release, and have been blamed for one of the most extreme climate events in geological history.
The last type of permafrost to be discussed here is ‘yedoma’. This is a feature of the very furthest reaches of the Arctic, and is formed by windblown dust freezing together to form a layer of dirty ice and sediment. These thick ice layers are often found on the Arctic coast, where they have no defences against the incoming waves from the Arctic Ocean and are eroded easily. As the Arctic warms, the sea ice that usually protects the coastline from the force of the waves is reduced to nothing, allowing the full power of the sea to erode into the shoreline
Liquid Chromatography is the separation of molecules from a mixture using a liquid carrier medium.
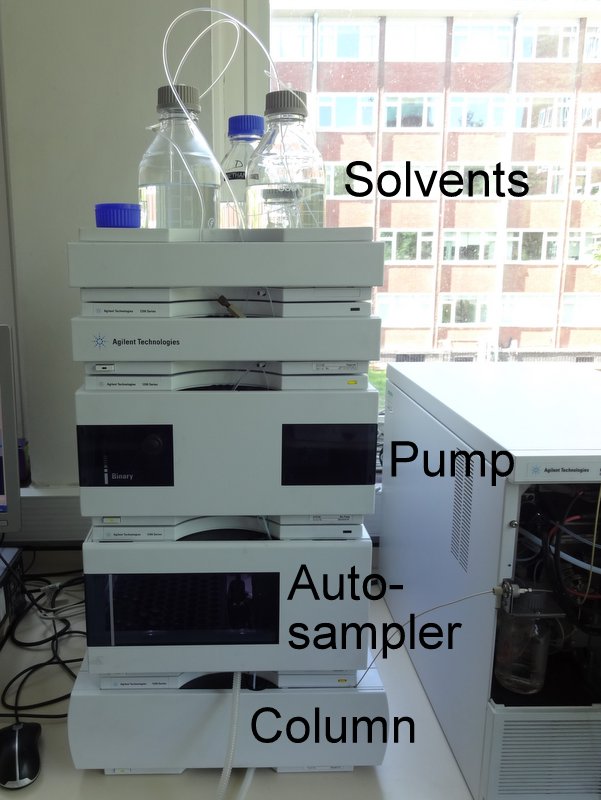
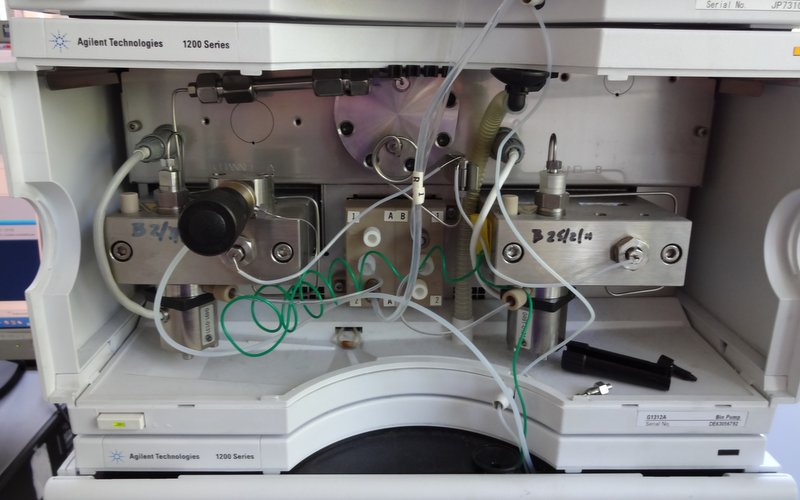
An organic geochemist will often have the problem of having a test tube containing a large amount of different molecules, but only being interested in one or two of them. Much like a child might place felt tip pen and water onto some filter paper to watch the colours run and separate out (with some very artistic results), with liquid chromatography (LC) we split our mixture of molecules up into its individual components so that they can then be analysed. An LC, sometimes known as HPLC where (HP means High Performance or High Pressure), consists of three main parts: the autosampler, the pump, and the column, labelled in the picture below:
Agilent LCMS
The autosampler collects a syringe full of sample from a vial and injects it at the right time onto the column. You can do this job yourself if you have good timing, are very accurate, and have an exceptionally high boredom threshold; the autosampler allows you to queue up a large amount of samples ready to run while you are away from the machine.
Autosampler
The pumps mix two solvents together and push them through the column. Each chemical in your mixture will behave differently when exposed to each solvent, it will be more soluble in one than the other, and will be differently soluble to the other chemicals in the mixture. Often one of the solvents will be polar (have an electrical charge associated with it, e.g., isopropanol alcohol) and the other will be non-polar (be electrically neutral, e.g., hexane). During the sample run, the amount of each solvent being washed through the column will change, and therefore different chemicals will wash through at different times.
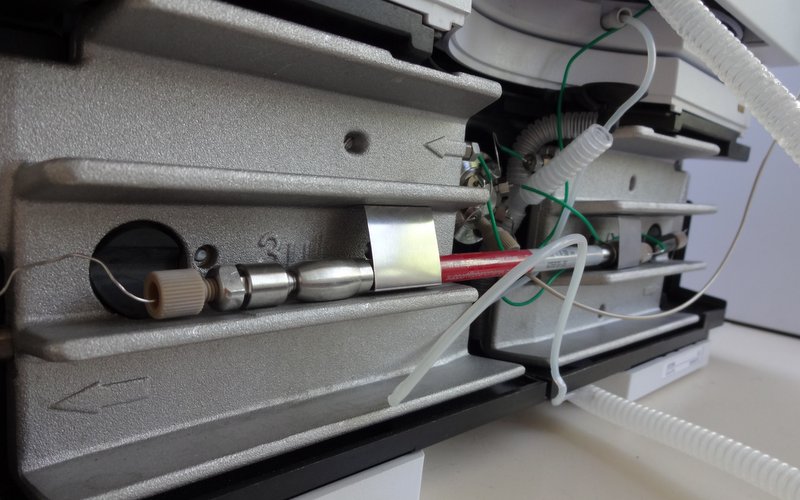
Pumps
The column is a metal tube filled with small solid particles. These are slightly ‘sticky’ to the molecules passing by (they adsorb onto the particle surfaces) and so the chemicals in the samples are not washed through the column that quickly. The solvents that are being used in the experiment remove the molecules from the column particles and move them through the system, until they reach the end of the column and can be detected. At the end of a sample run, the flow on the column is reversed and anything that did not make it through to the end is cleaned out (the ‘backflush’)