Today’s news comes from a talk by Dave Hollander about the 2010 Deepwater Horizon oil spill.
Did you know that only 25% of the oil made it to the sea surface? The extremely high pressure, generated by the oil being 18km below the sea floor, caused the ejected oil to form microscopic particles too small to float to the surface. Instead, a plume of toxic oil formed at 1000m water depth and drifted along the continental margin. This “toxic bathtub ring” killed all seafloor organisms for thousands of square km.
To compound this, oil at the surface was broken up using dispersant and flushed back out to sea by increasing the flow of the Mississippi River. Once out at sea, algae bound the oil droplets together, causing them to sink down as a “flocculant dirty blizzard”. While these processes avoided the politically sensitive issue of oil covering the shoreline and killing large numbers of birds and mammals, the disaster has been moved to the deep sea, where it’s harder to see but also harder to fix, and the effects are still working their way through the system. Fish caught today in the Gulf of Mexico are showing symptoms of lethal oil ingestion, and it could take years for the ecosystem to recover.
Category: News and Views
IMOG 26, Tenerife(!)
This week I am at the 26th IMOG conference, which is taking place in the cold, wet setting of Tenerife. IMOG, the International Meeting on Organic Geochemistry, is a medium sized conference devoted to both academic biogeosciences, especially molecular studies, and also cutting edge research from the oil industry.
Fact of the day: speleothems (stalactites and stalagmites) contain less than 0.01% organic carbon – they are mostly calcium carbonate of course – but you can dissolve away the minerals and inject this tiny fraction directly into an LCMS in order to measure specific organic molecules, and even calculate their carbon isotope composition!
Dr Heath-Robinson
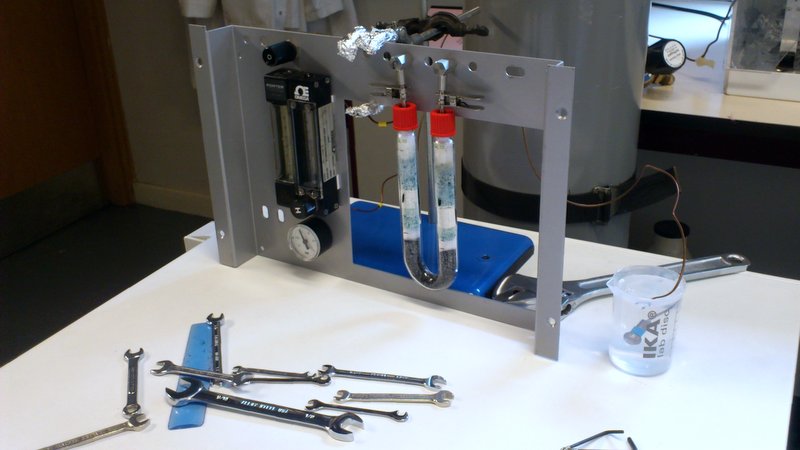
Sometimes science involves £1 million machinery, exciting state-of-the-art laboratories, expensive and/or explosive chemicals, travel to far-flung exotic lands and schmoozing over canapes. Sometimes it involves retrieving some bits and bobs from a series of dusty drawers and bodging them together into something approximating workable equipment. Today was one of those days. I’ll explain Pyrolysis in a later post, but the aim of today’s work was to create an offline-pyrolysis set-up that can be used to prepare large quantities of sample for analysis later on. The pyrolysis oven itself was already in place, but a regular flow of nitrogen gas is needed to blow through it and transport the chemicals that are released.
Delving around in the back of the lab, we managed to find the inner workings of an old carbon analysis machine sitting in pieces in a drawer. There were flow regulators; lots of copper pipes; a series of connecting nuts and bolts, of which most were incompatible with each other, but some that would play nicely; a couple of glass tubes filled with unknown solids; a pressure sensor; and a piece of steel that once lived inside the machine.
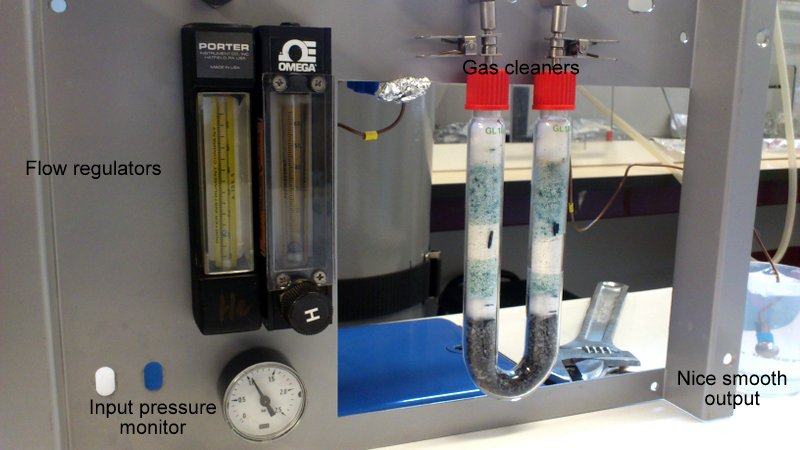
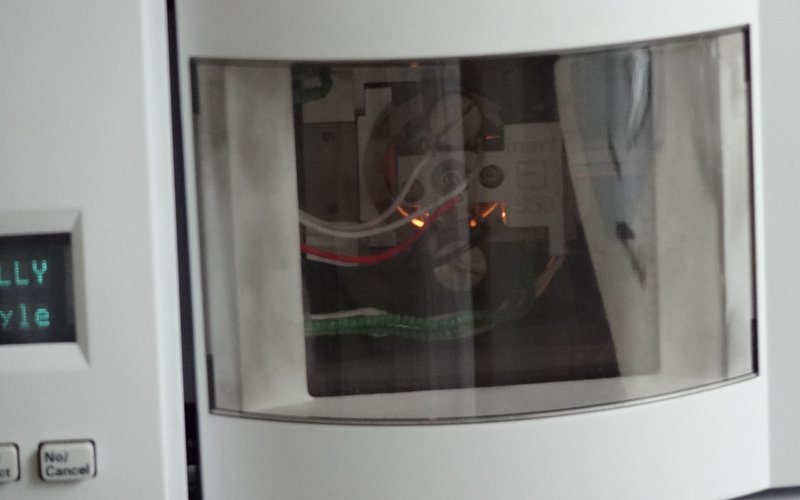
And here we have it! Gas comes from the bottle in the background into the first flow regulator. In an attempt at clarity and sensibility, this is the one on the right hand side, with the “H” dial on, since that’s the only way that the pipework at the back would work properly. At this point the input pressure from the bottle is measured as well, which will hopefully correspond nicely to the pressure measured from the regulator. This first regulator is more of a glorified tap, able to determine roughly how much gas comes through the system but not to accurately control the output rate.
Once the gas has flowed through here, the second flow regulator (on the left) has a much more precise knob (just out of shot above the word “PORTER”) that determines how much gas can flow through the rest of the system. This regulator also has a little floating ball gauge to show the flow rate.
After that, the gas is cleaned in the u-bend. This will remove any liquid from the gas, so that it is nice and dry when it passes onto the samples, hopefully preventing them from reacting with the gas at all.
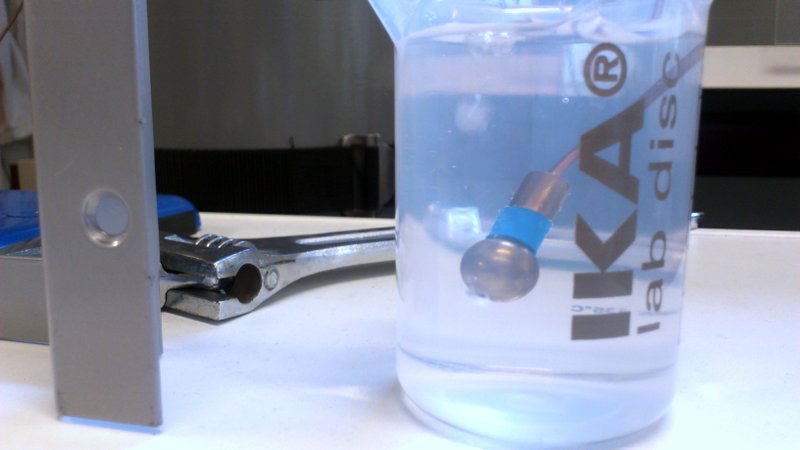
The last item on this test rig, is the output testing device. A glass of water.
Just how much permafrost is there?
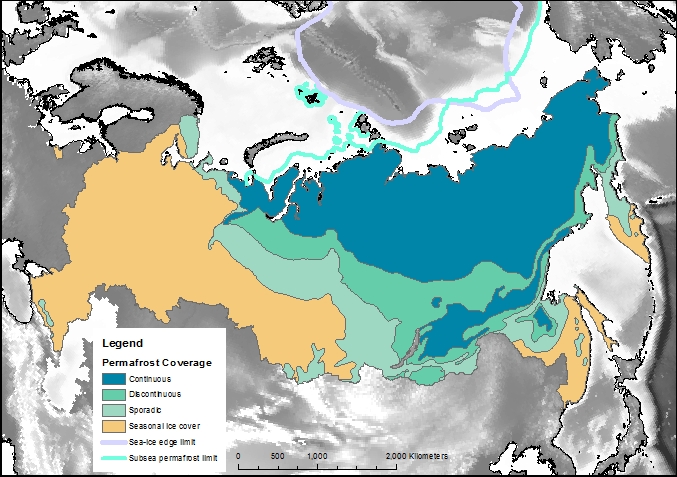
Permafrost covers 24% of the Earth’s northern hemisphere land surface, but how much is that? Well 24% corresponds to 23,000,000 km2. That is a pretty big number, and doesn’t even count the subsea permafrost that covers lots of the Arctic Shelf (see the map above) so here are a few comparisons and measurements in less standard units.
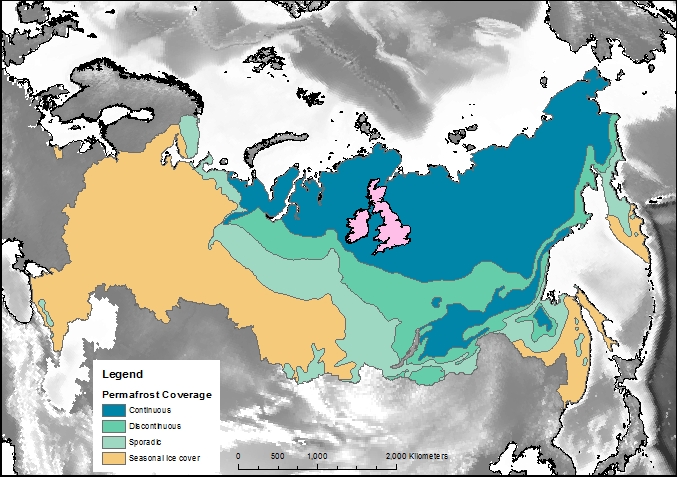
Firstly, let’s compare the permafrost area to some other countries and continents. Here is Britain in comparison, at 243,000 km2 it is almost inconsequential. Only one tenth of the northern hemisphere permafrost. Going up the scale Australia, with an area of 7,700,000 km2, is one third of the northern hemisphere permafrost, and roughly the same size as the 7,400,000 km2 that continuous and discontinuous permafrost represent in Siberia alone.
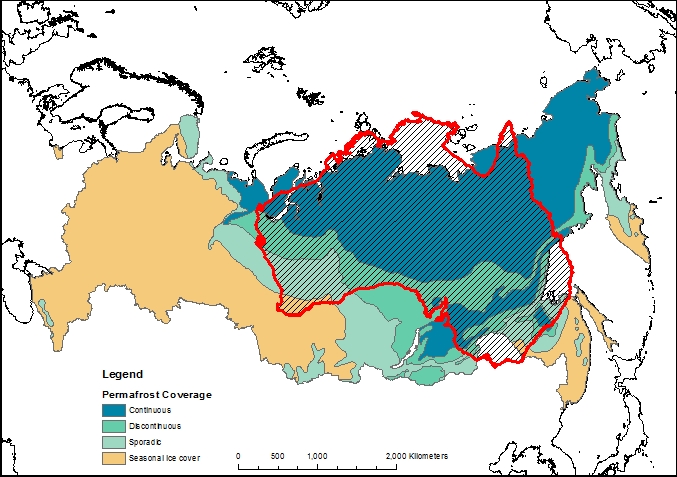
The maps above use data from the National Snow and Ice Data Centre
The World according to Siberia
When displaying data near the poles, the choice of map projection is very important. Displaying a 3D object in a 2D screen is always problematic, and involves compromises in either accuracy, practicality or legibility. The standard Mercator projection, as used in the majority of maps seen on a day-to-day basis, stretches the polar regions to infinity. Greenland looks enormous on this map, yet it is actually just smaller than the Democratic Republic of the Congo, and only one quarter of the area of Brazil. To get around this problem, other map projections are available.

The projection I have chosen to use for maps of the Siberian permafrost is the Lambert Azimuthal Equal Area map. This projection adjusts shapes and distances in order to preserve the true area of each country. If you look at the full-size version of the map above (click it, or download here) then the view of the Arctic region is relatively consistent with the true layout as viewed from above, but there is an increasing amount of distortion as the distance from Siberia increases.
Look out for this projection in future posts!
When it all goes haywire
Sometimes it all seems to go wrong at once – yesterday we needed to replace a gas regulator, replace a broken filament in the Mass Spectrometer, clean several months of dirt from the filament housing, and pump all the air out of the system to make a vacuum again.
The important thing when setting everything up again is to run a standard. This will check that the machine is functioning properly before there is a risk of wasting precious samples in faulty equipment. A standard sample will be simple enough to produce a consistent result, but complex enough to produce more than just one peak in the chromatogram.
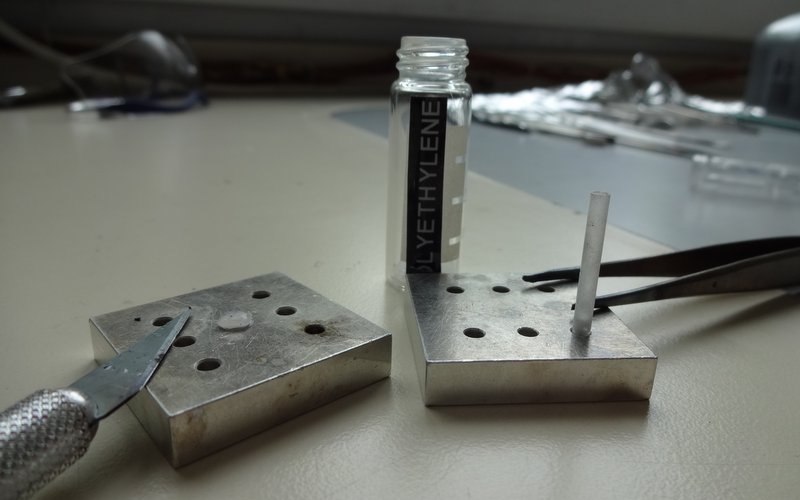
We use poly-ethylene as a pyrolysis standard because the long polymer chains will break into a range of sizes during the heating phase. This produces a nice series of identical peaks, which emerge from the column in the order of their chain length. As long as this run comes out clean, it’s good to go.
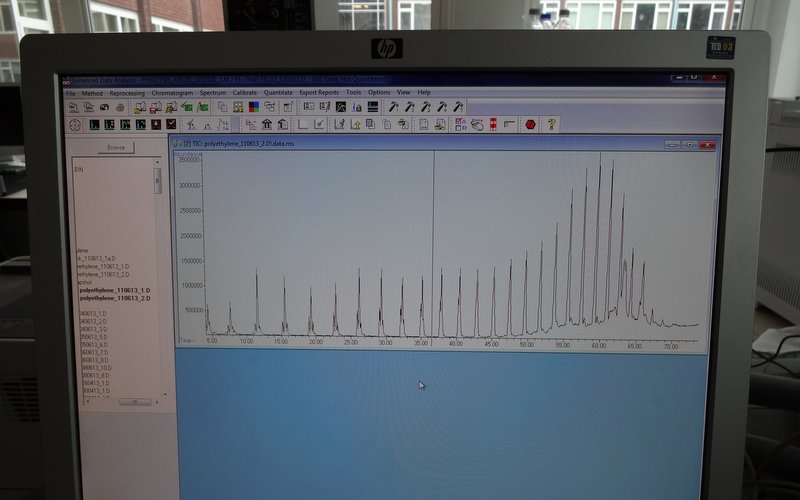
Perfect – now the GC is up and running again