What is: Liquid Chromatography (LC)?

Liquid Chromatography is the separation of molecules from a mixture using a liquid carrier medium.

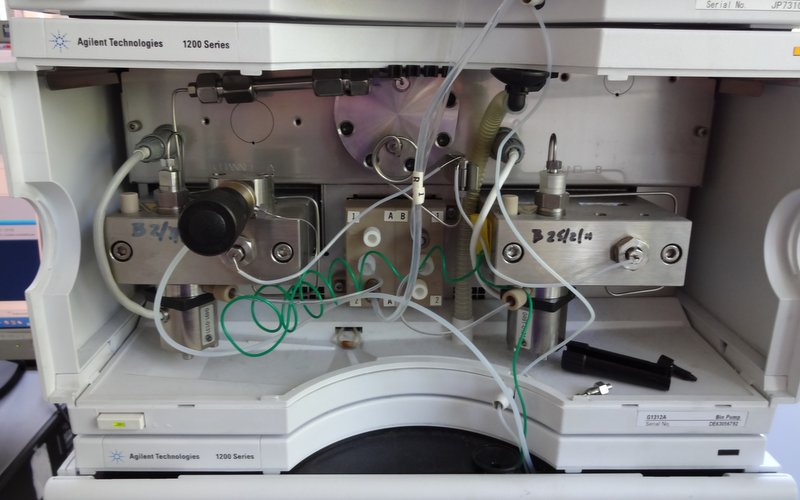
An organic geochemist will often have the problem of having a test tube containing a large amount of different molecules, but only being interested in one or two of them.  Much like a child might place felt tip pen and water onto some filter paper to watch the colours run and separate out (with some very artistic results), with liquid chromatography (LC) we split our mixture of molecules up into its individual components so that they can then be analysed. An LC, sometimes known as HPLC where (HP means High Performance or High Pressure), consists of three main parts: the autosampler, the pump, and the column, labelled in the picture below:

Agilent LCMS
Agilent LCMS

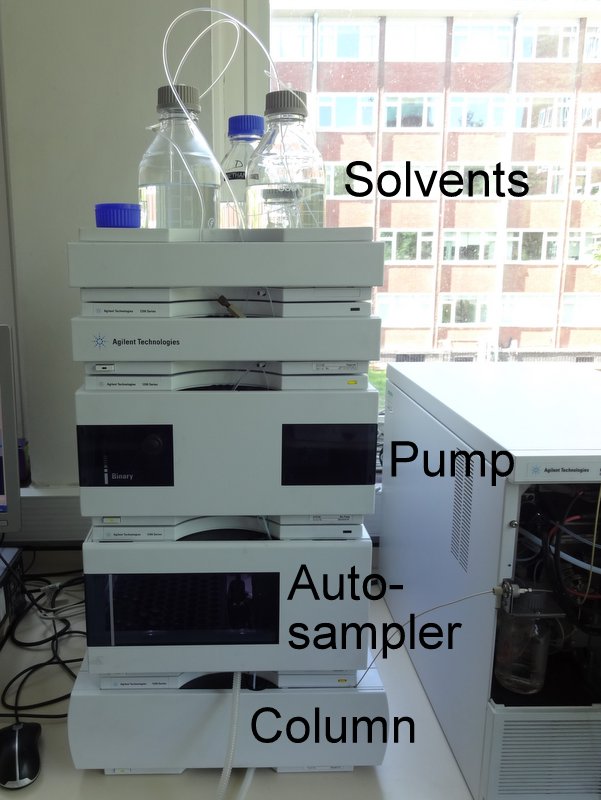
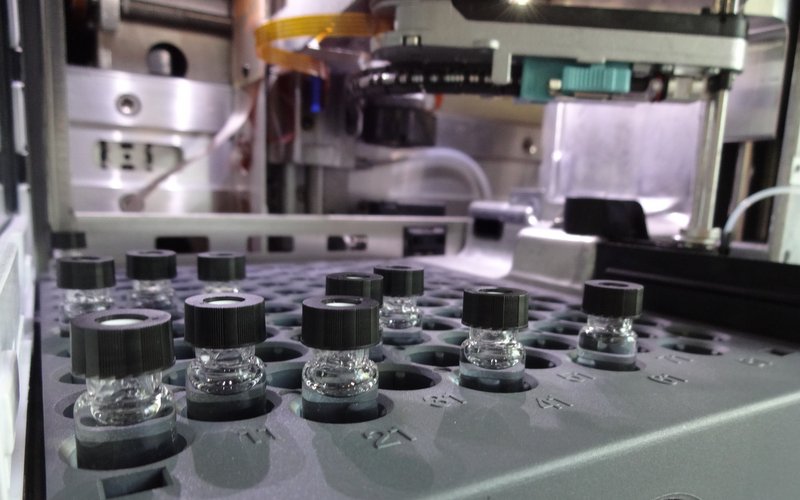
The autosampler collects a syringe full of sample from a vial and injects it at the right time onto the column. You can do this job yourself if you have good timing, are very accurate, and have an exceptionally high boredom threshold; the autosampler allows you to queue up a large amount of samples ready to run while you are away from the machine.

Autosampler
Autosampler

The pumps mix two solvents together and push them through the column. Each chemical in your mixture will behave differently when exposed to each solvent, it will be more soluble in one than the other, and will be differently soluble to the other chemicals in the mixture. Often one of the solvents will be polar (have an electrical charge associated with it, e.g., isopropanol alcohol) and the other will be non-polar (be electrically neutral, e.g., hexane). During the sample run, the amount of each solvent being washed through the column will change, and therefore different chemicals will wash through at different times.

Pumps
Pumps

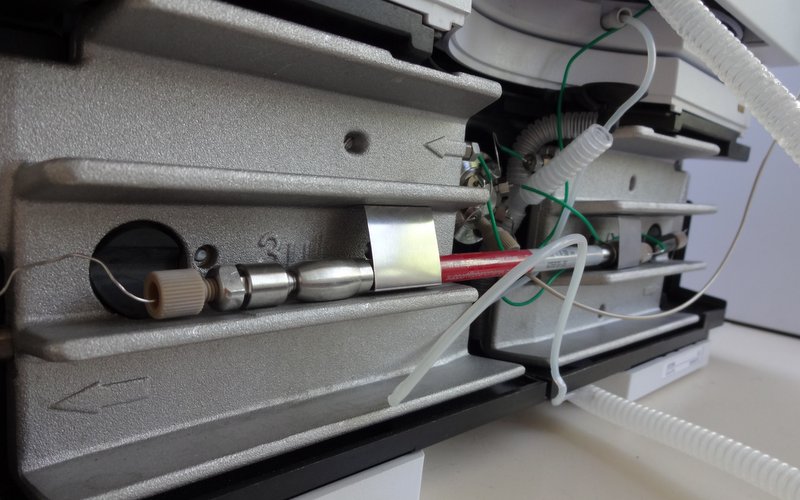
The column is a metal tube filled with small solid particles. These are slightly ‘sticky’ to the molecules passing by (they adsorb onto the particle surfaces) and so the chemicals in the samples are not washed through the column that quickly. The solvents that are being used in the experiment remove the molecules from the column particles and move them through the system, until they reach the end of the column and can be detected. At the end of a sample run, the flow on the column is reversed and anything that did not make it through to the end is cleaned out (the ‘backflush’)

Column
Column

Subducted seafloor relief stops rupture in South American great earthquakes

This was my first published paper, based on research undertaken during my Masters. It is published in Earth and Planetary Science Letters, and available for download the MMU e-space repository.

The initial observation for this work was that ‘great’ earthquakes, those which measured more than magnitude 8.0, tend to have end points in the same place. An earthquake end point is the limit to the earthquake fault plane movement, shaking will take place outside of this zone but it is most violent in the regions above the fault plate movement. The figure below shows the rupture zones and end points for great South American earthquakes.

Rupture zones and subducting topography in South America

An initial inspection of the plate margin (where the incoming Pacific Plate is subducted underneath the South American Plate) suggested that when there are underwater mountains on the Pacific Plate coming into the subduction zone (black blobs on the figure above), these tend to match up with the end points of earthquakes. The figure below shows how topographic features (underwater mountains and ridges) match up with earthquake locations.

Subducting topography and earthquake locations

To test whether this was a real relationship, or just coincidence, I designed a model that produced earthquakes along the subduction zone. The model had two versions. In version one, earthquakes were placed in line along the subduction zone (as tends to happen in these situations, one earthquake starts at the end point of a previous one) but their end points were not constrained by anything. In the second version, if the earthquake tried to rupture past an incoming topographic feature, the rupture was stopped there.

By applying statistical tests to the model, I showed that the endpoints of earthquakes were far more likely than random chance to be located where topography > 1000m was being subducted. The model also showed that subducting topography led to a reduction in background earthquakes. At earthquake endpoints not associated with topography, there was an increased amount of smaller earthquakes releasing the built-up stress, but this was not seen at earthquake endpoints near to subducting topography. Therefore, subduction of a high seamount or ridge makes the subduction zone earthquake activity decrease (it becomes ‘aseismic’) which prevents both great earthquakes getting past, and smaller earthquakes from occurring.