Distributions of bacterial and archaeal membrane lipids in surface sediments reflect differences in input and loss of terrestrial organic carbon along a cross-shelf Arctic transect

This paper was published in Organic Geochemistry, and is available open-access through the journal website and the MMU e-space repository. In the paper we take a detailed look at lipid biomarkers along a transect from the Kolyma River to the Arctic Ocean.

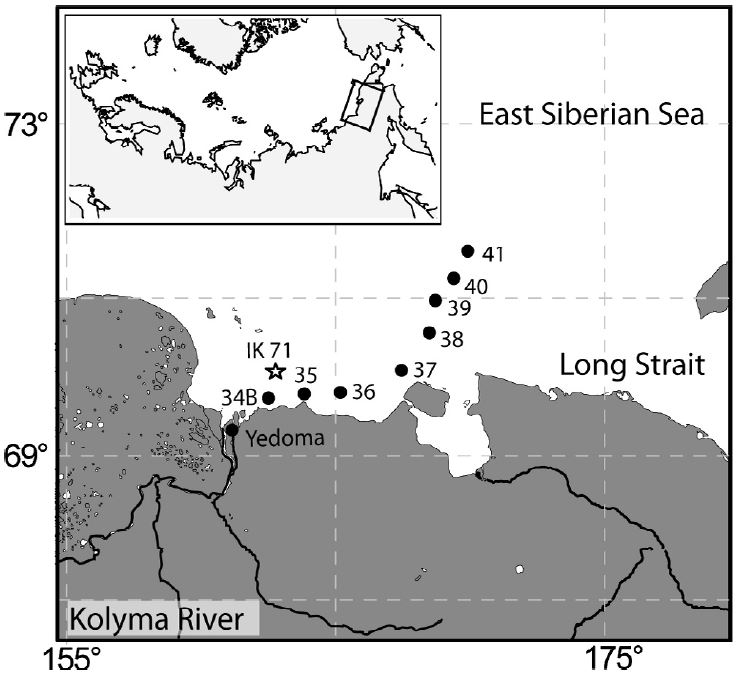
The data used in this paper is a subset of the data from across the East Siberian Artic Shelf (ESAS) published shortly afterwards in Biogeosciences. In this paper we took a closer look at the offshore trends seen in material delivered to the ocean by the Kolyma River, the easternmost of the Great Russian Arctic Rivers. The Kolyma River catchment is entirely underlain by continuous permafrost, which makes this are an extreme endmember in terms of permafrost systems. The main sources of organic matter from the Kolyma region are river erosion, mostly from top few metres of soil, the active layer that freezes and thaws each year, and coastal erosion from the “yedoma” cliffs along the shoreline.

Sample locations for the Kolyma River - ESAS transect
Sample locations for the Kolyma River – ESAS transect

These samples had previously been analysed for bulk properties (total organic carbon content, carbon isotope ratios) and some basic biomarker measurements, but we added complex lipid analyses to the story. We measured both GDGT and BHP lipids, these are found in microbes and can be analysed using LCMS. Amongst the many applications of these lipids, they can be used to trace the amount of soil found in offshore sediments. Each group of molecules has an index associated with it: GDGTs are used in the BIT index and BHPs are used in the R’soil index. Values of 0 would have no soil input and 100% marine carbon, while values towards 1 would be dominated by soil.

Offshore trends in the BIT and R'soil indices
Offshore trends in the BIT and R’soil indices

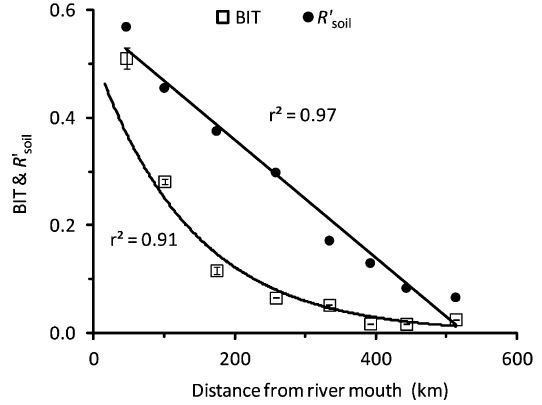
Usually these indices show the same offshore trends, which would be expected since they are both supposed to be tracing the same number – the proportion of carbon coming from soil. However, as the figure above illustrates, the two indicies have very different patterns from the river mouth (0 km) across the shelf (500 km). The BIT index drops quickly offshore, making a curved offshore profile, but the R’soil index forms a straight line offshore. Therefore two different techniques, supposedly measuring the same thing, don’t show the same results.

We think that this is due to the source of lipids used to make each index. Branched GDGTs (from soils) are common in sediments close to the river mouth, but their concentration drops quickly offshore. Marine GDGT concentrations increase across the shelf and this combination causes the BIT index to decrease rapidly. Branched GDGT concentrations in soils and lakes on land are high, but they are very rare in the coastal permafrost cliffs. Therefore any coastal erosion is not really affecting the BIT index.

On the other hand, soil marker BHP molecules are found in river sediment and coastal permafrost, and so there are two terrestrial sources. The concentration of soil marker BHPs drops much slower offshore than for the GDGTs. Also different, the concentration of the marine BHP marker doesn’t increase offshore. This combination means that the R’soil index drops much slower than the BIT index.

In the end, what this paper mainly shows is that when using biomarkers as proxy measurements for something else one single result is probably not enough. Proxy measurements are valuable tools, but they depend on measuring one thing to discover another. Combining multiple proxies together adds value and reliability to a study, either by confirming a hypothesis or bringing new insights.

Decadal carbon discharge by a mountain stream is dominated by coarse organic matter

This paper, with Jens Turowski and Bob Hilton, was recently published as an open-access article in Geology and is available from the journal website and via the MMU e-space repository. In it we show that erosion and transport of large woody material (coarse particulate organic carbon; CPOC) is very important in terms of the overall carbon cycle, but is concentrated in very extreme events.

The research is based in the Erlenbach, a small river in the Alps that has been studied by Swiss researchers for several years. They have built a very sophisticated stream sampling station, which can capture everything that flows down past a gauging station. There is a large retention pond that catches the logs/pebbles/sediments and a shopping-trolley sized wire basket that can be moved into the middle of the stream to catch a particular time point (for example the middle of a large storm). The photo below was taken during winter when the river was frozen over, but you can see the v-shaped river channel, the three wire baskets ready to move into position to catch material, and the snow in the foreground covering the retention pond.

The sampling system in the Erlenbach River during winter

This sampling system led to Jens observing that there was a lot of CPOC coming down the river and piling up in the retention pond. A quick calculation suggested that this was a significant portion of the total carbon coming out of the river catchment, but the scientific consensus was that actually more carbon came through as fine particles than CPOC. An experiment was designed to test this.

Across a wide range of river flow speeds, the amount and size of woody debris flowing down the river was measured, both waterlogged and dry material. This allowed a rating curve to be defined – that is for a given river flow speed, how much organic carbon would be expected to flow down the river? The rating curve was very biased towards the high-flow end for CPOC, much more so than for fine carbon (FPOC) or dissolved carbon (DOC). At low flow rates, very little CPOC is moved, but at high flow rates a very large amount is mobilised.

Rating curve of organic carbon types vs. river discharge

During the 31 years of data collection there were four particularly large storms. Integrating over the rating curve shows two things. Firstly, if the large storms are ignored then the Erlenbach is already a major source of CPOC, about 35% of the total carbon, with CPOC being roughly equal to the FPOC estimate. Thus it is much more important than might previously have been imagined. If the extreme events are included, the CPOC becomes ~80% of the total organic carbon transported by the river.

A majority of the CPOC transported by the river was waterlogged, having sat on the river bank or behind a log jam while waiting for a large storm to wash it downstream. Waterlogging increases the density of the wood and makes it more likely to sink when it reaches a lake or the sea. My contribution to the paper was to provide evidence of this process. My PhD work in the Italian Apennines found CPOC, from millimetre scale up to large tree trunks, that had been preserved in ocean sediments for millions of years. Again, a lot of this CPOC is too large to measure using standard techniques, and suggests that rivers can deliver organic carbon from mountains to the ocean far more efficiently than previously thought.

Elephant Moraine 96029, a very mildly aqueously altered and heated CM carbonaceous chondrite

This paper is a result of collaboration with researchers at the University of Glasgow who I met while interviewing for a position. I didn’t get the job, but I did get talking to Paula Lindgren and we discovered a common interest in using Raman Spectroscopy to study organic carbon. This publication is the first result of that, and is available as an open-access article.

A little bit of meteorite, under an electron microscope

The paper is a comprehensive study of a meteorite collected from Antarctica. Antarctica is a great place to find meteorites because they sit on top of the ice and are easy to spot – sometimes the flow of ice even concentrates them into particular areas to makes things even easier. This meteorite is classified as a “CM carbonaceous chondrite” and has experienced very little change since it was part of the protoplanetary disc billions of years ago. Therefore we can use it like a time capsule to look at what the early solar system was like.

However, some meteorites are better time capsules than others. As they float around the solar system, they can build up ice, which can then be melted by radioactivity and the water released can alter the crystallography of the meteorite. Our paper uses a wide range of techniques to characterise the meteorite and show that it is one of the least altered carbonaceous chondrites ever found.

The techniques used included electron microscopy (both scanning and transmission techniques; SEM and TEM), X-ray analysis, X-ray diffraction, thermogravimetric analysis (TGA), oxygen isotope measurements and Raman Spectroscopy. My contribution was to use my automatic Raman processing technique to determine how crystallised the carbon in this meteorite was in comparison to carbon in other meteorites.