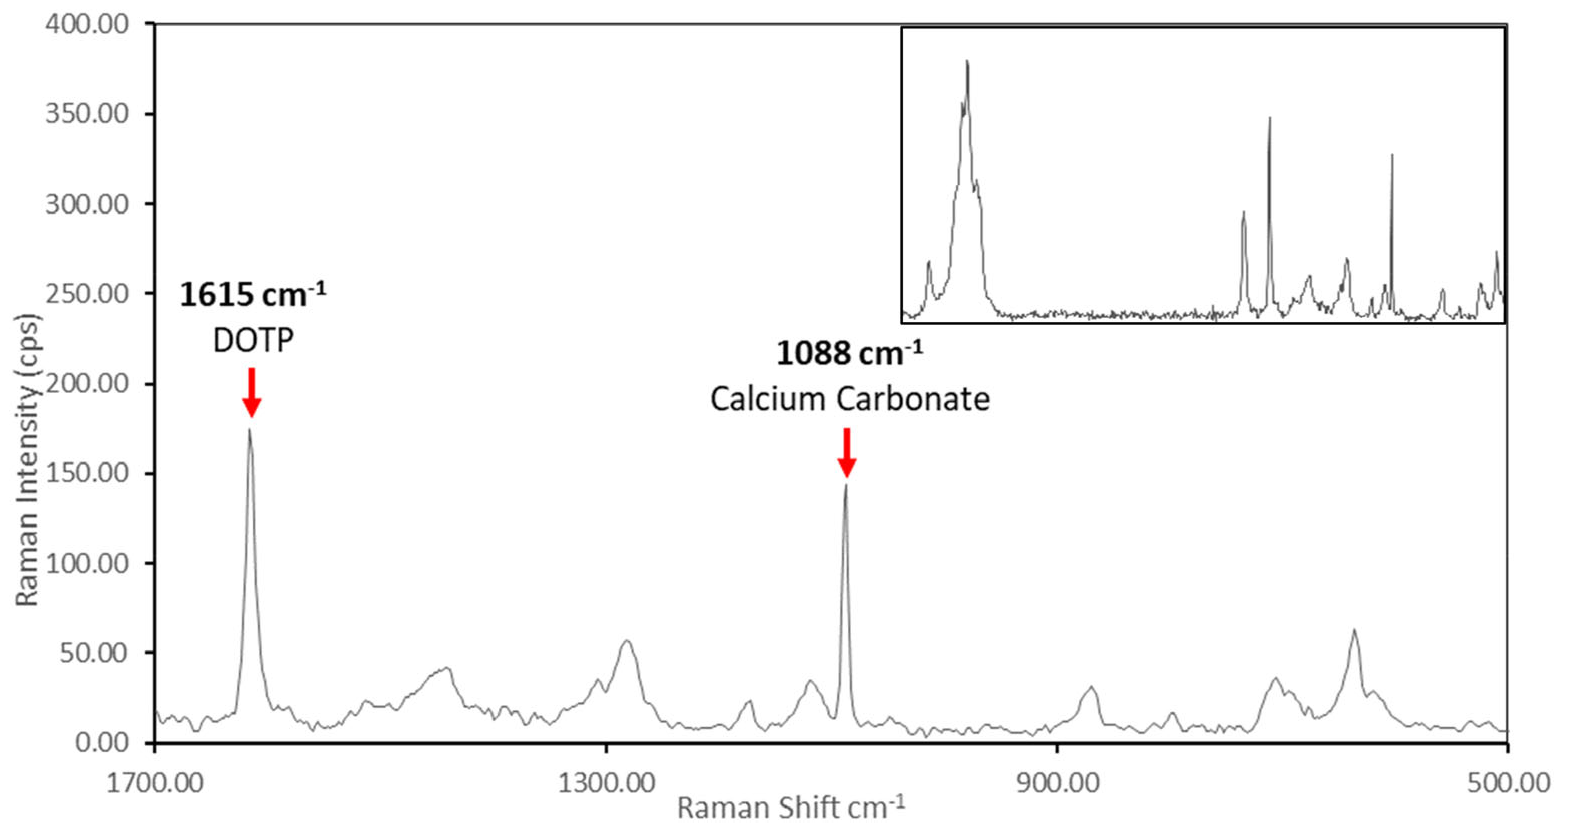
Typical results when measuring PVC using Raman spectroscopy
A slight detour from my usual environmental chemistry work, this paper was led by PhD student Kate Irvin and looks at characterising PVC samples in an industrial setting, finding ways to optimise the product development process.
When developing a new polymer product, it is important to regularly test its properties and confirm its ingredients. Typical tests take hundreds of hours and can delay the development cycle, adding costs to the process. In this paper we demonstrate some rapid, non-destructive techniques for quantifying the amount of plasticiser (dioctyl terephthalate) and filler (calcium carbonate) within a PVC sample.
Fourier transform-infrared spectroscopy and Raman spectroscopy were used, since they are quick, easy-to-use and non-destructive methods of identifying samples. The time savings alone of using these methods compared to using traditional hardness, softness and tensile tests could reduce product development costs by 50%.
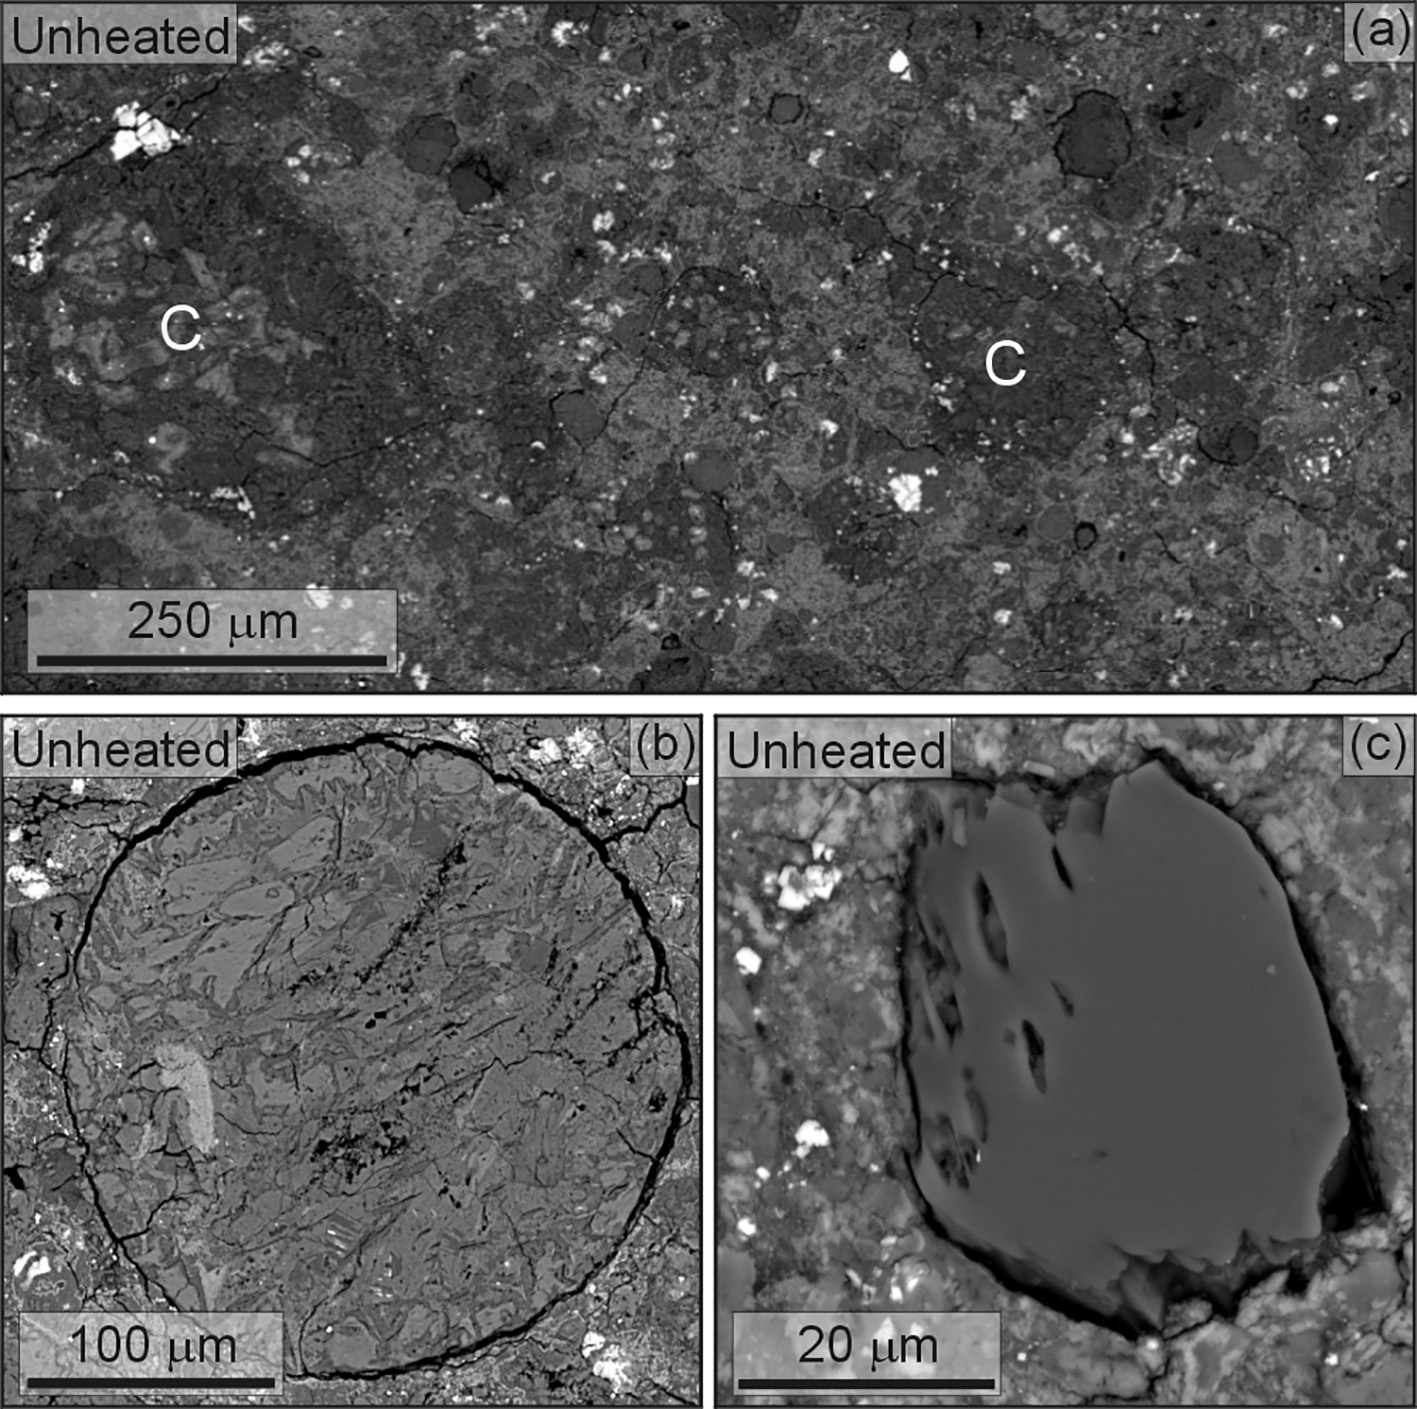
Backscatter electron microscope images of a meteorite
This paper is available as an Open Access article via the journal.
This research paper continues the work of Paula Lindgren, who I worked with earlier when looking at a suite of meteorites. In this paper, a single carbonaceous chondrite meteorite was heated in the laboratory to simulate the heating that took place during the life of a meteorite. A sample was studied using a series of different techniques, including scanning electron microscopy, Raman spectroscopy, infra-red spectroscopy, oxygen isotopic analysis and X-ray diffraction. It was then heated to 400 °C and 800 °C and studied again. We found that the minerals, isotopes and organic matter all changed with heating. Sometimes 400 °C was enough to make a change, sometimes no change was observed until 800 °C.
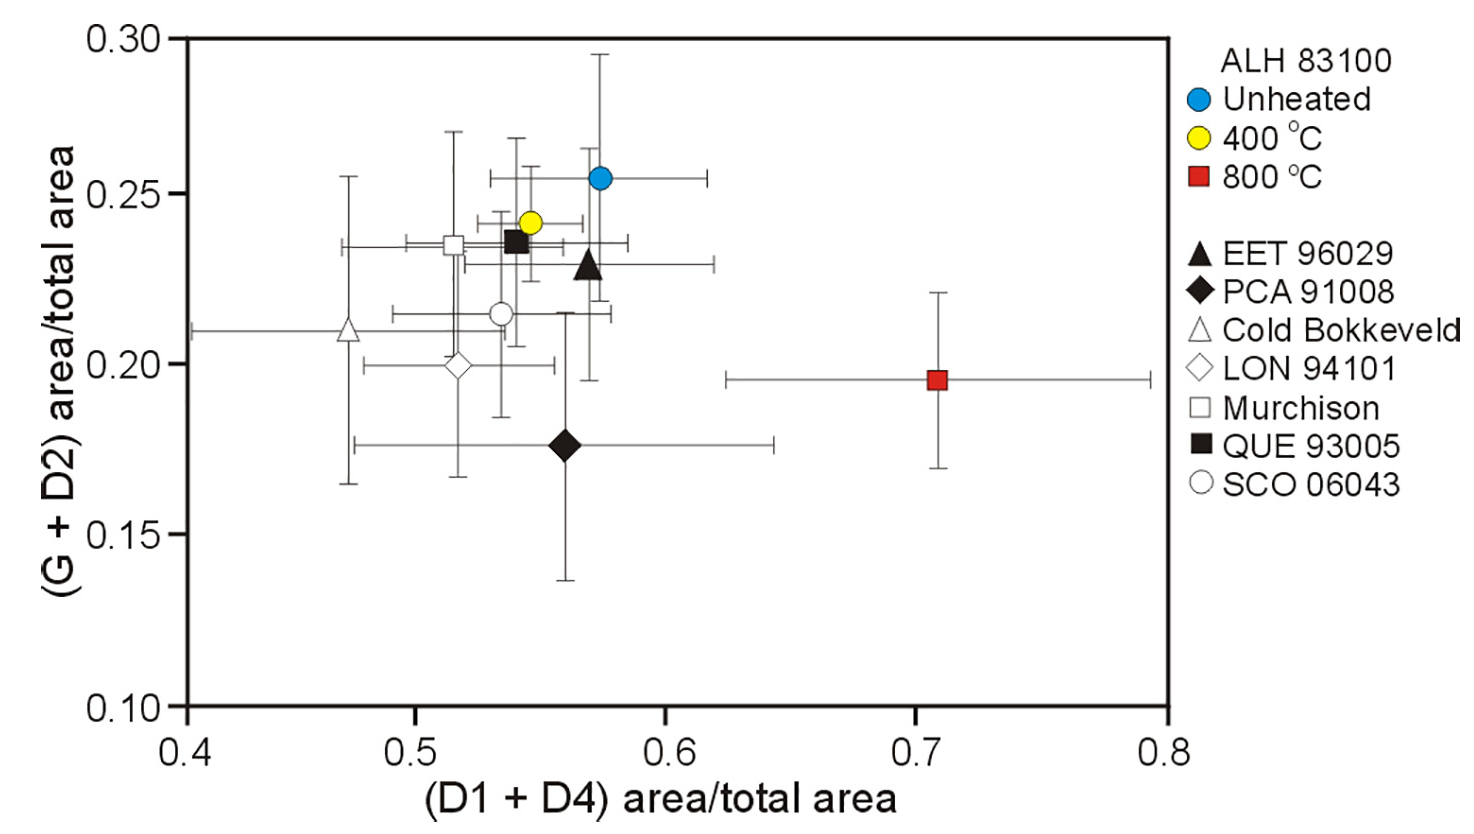
Changing Raman spectropscopy measurements from unheated (blue), 400 °C (yellow) and 800 °C (red) samples of the same meteorite
These changes can be used to work out the thermal history of meteorites collected on Earth, and even for asteroids sampled in space!
This paper shows how organic carbon, when deeply buried and transformed into graphite, can survive multiple cycles of erosion, transport and burial. It is available, open-access, from the journal website.
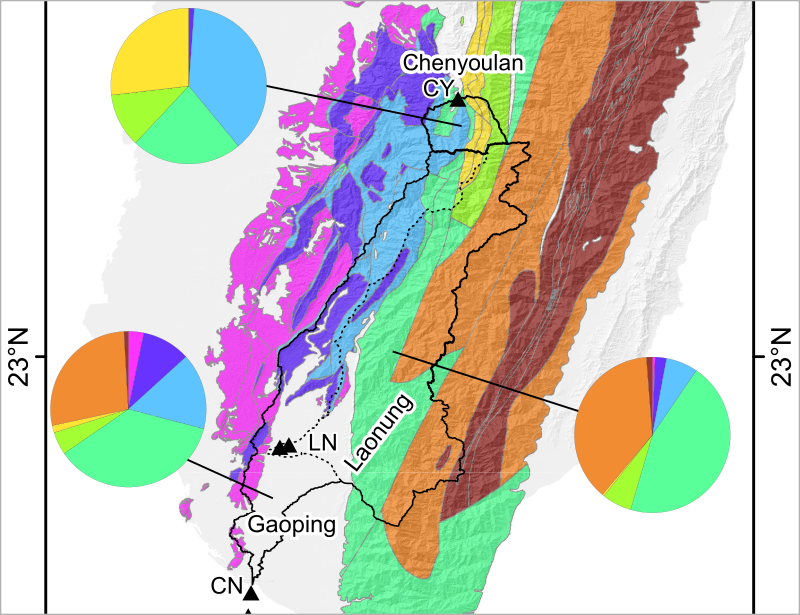
River catchments in southwestern Taiwan contain lots of different rock formations
The samples came from Taiwan, which has a pretty extreme tectonic and climatic setting. The convergence of the Eurasian and Philippine Sea plates leads to rapid mountain building, and the impact of severe typhoons each year leads to large amounts of erosion. This means that lots of sediment is removed from the island each year, including from rocks that were previously buried deep under the island, and metamorphosed. I looked at samples collected from several river catchments in the southwestern part of the island, and from some offshore cores. Some of these catchments drained the Central Range mountains, and others the Western Foothills and Coastal Plain. The rocks in these two regions are very different, especially in terms of the carbon they contain.
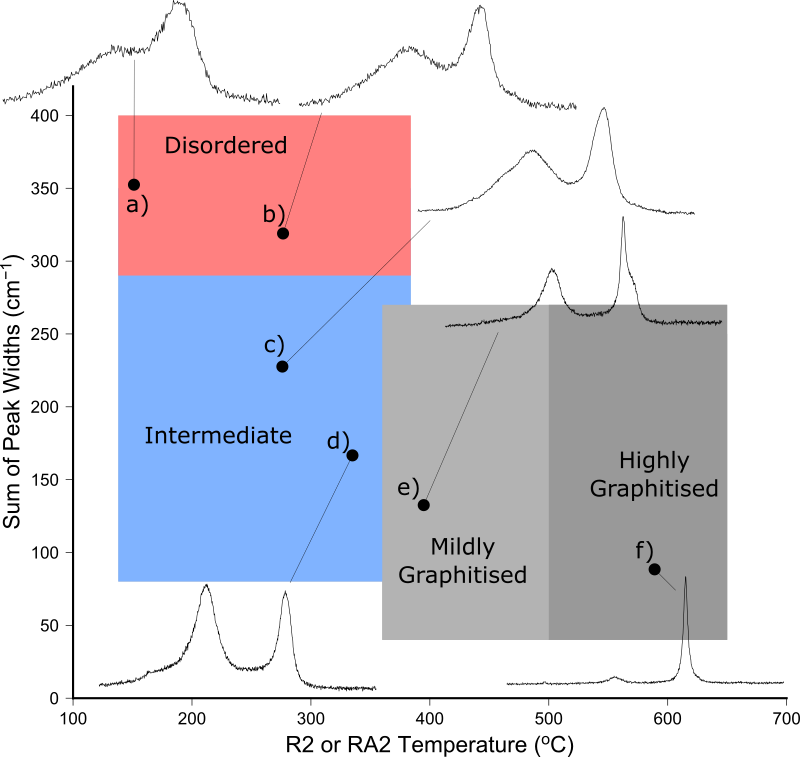
Differentiating betwen graphitic and disordered carbon using Raman spectra
The analytical work was based around the Raman spectroscopy technique I developed during my PhD (published back in 2013). Raman spectra were collected from particles of organic carbon in the sediments, and automatically processed to determine which Raman peaks were present, where they were located, how tall and how wide they were. The peaks found in each sample were used to show the types of carbon present in each rock. As each particle is analysed independently, there is no averaging effect if a samples is a mixture of several sources.
This analysis showed that rivers draining the youngest rocks, which had experienced the least metamorphism, had the most graphite in. The rivers draining the most metamorphic rocks had little or no graphite. This could only be explained if the graphite was eroded from somewhere else and then deposited into the Taiwanese sediments before they became rocks. The graphite-rich rocks were sourced from Taiwan itself – the rapid tectonic uplift means that a lot of material has been removed from the top of the mountains and washed into the surrounding ocean. Yet there are no rocks in Tawain that have been buried deep enough to make graphite, so the original graphite must have come from somewhere else entirely!
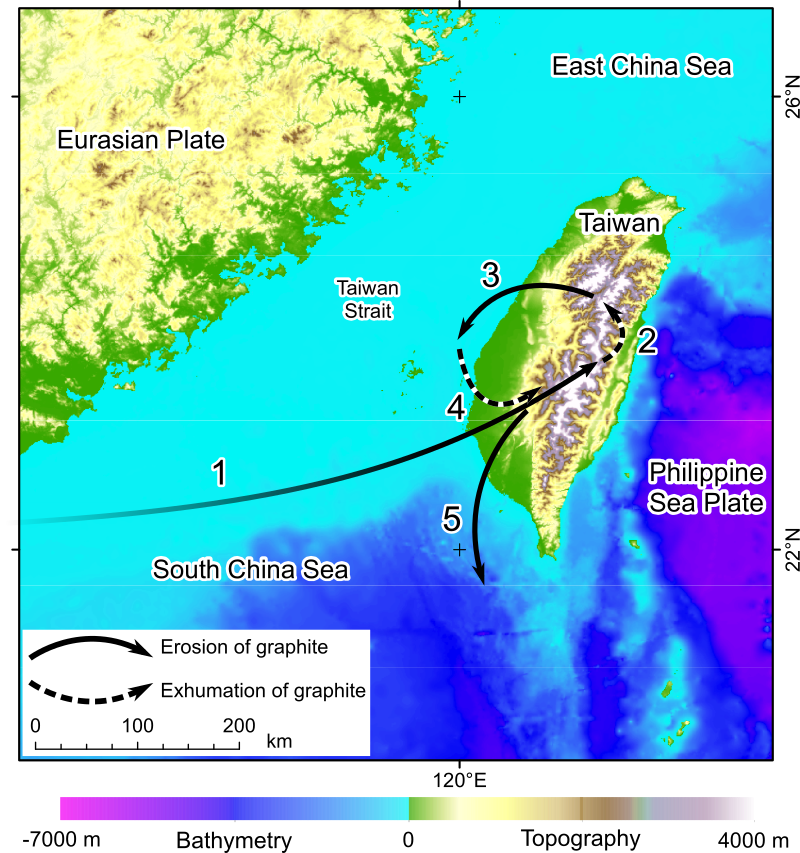
Three phases of graphite erosion (arrows 1, 3 and 5) and two of exhumation in the island of Taiwan (arrows 2 and 4)
Our best guess is that China was the original graphite source, since there are lots of graphite bearing outcrops in the regions near to Taiwan, eroding into the South China Sea. So the first phase of recycling was from China out onto the ocean floor before Taiwan became an island. Once the island appeared out of the ocean, the second phase of erosion moved these graphite rich sediments from the newly formed land back into the nearby seas (the second recycling phase). These rocks were then uplifted themselves, forming the Western Foothills of the island, and are now eroding for the third time out into the South China Sea. During all this time, some of the graphite has survived, and can be seen easily in the modern sediment.
All this means that graphite crystals are pretty stable, and can survive being eroded, transported and buried in sediments multiple times. They can be used as tracers, because although the rock they came from has been broken up into tiny pieces and dispersed across the ocean floor, each graphite flake can be characterised very precisely by Raman.
Turning organic carbon into graphite also gives it stability, stopping it from degrading back into carbon dioxide. On long timescales, this means that carbon is transferred from the atmosphere into the biosphere (trees and plants), and then into the lithosphere (rocks) where it can survive for millions of years.
In this paper, published in The Cryosphere, we used Raman spectroscopy to trace carbonaceous material from the shoreline to the furthest reaches of the East Siberian Arctic Shelf.
Raman spectroscopy uses laser light to determine the molecular structure of a wide range of materials. During my PhD, I showed that Raman could be used to probe individual particles of organic carbon to show whether they were disordered, like coal, or crystalline sheets of graphite. This collection of carbon particles, known as carbonaceous materials, are particularly hardwearing and resistant to breaking down during erosion and transport. During my post-doctoral research, I then used a range of organic geochemistry techniques to investigate the transition from terrestrial to marine carbon across the East Siberian Arctic Shelf, showing that coastal erosion and river erosion were both supplying organic matter to the ocean.
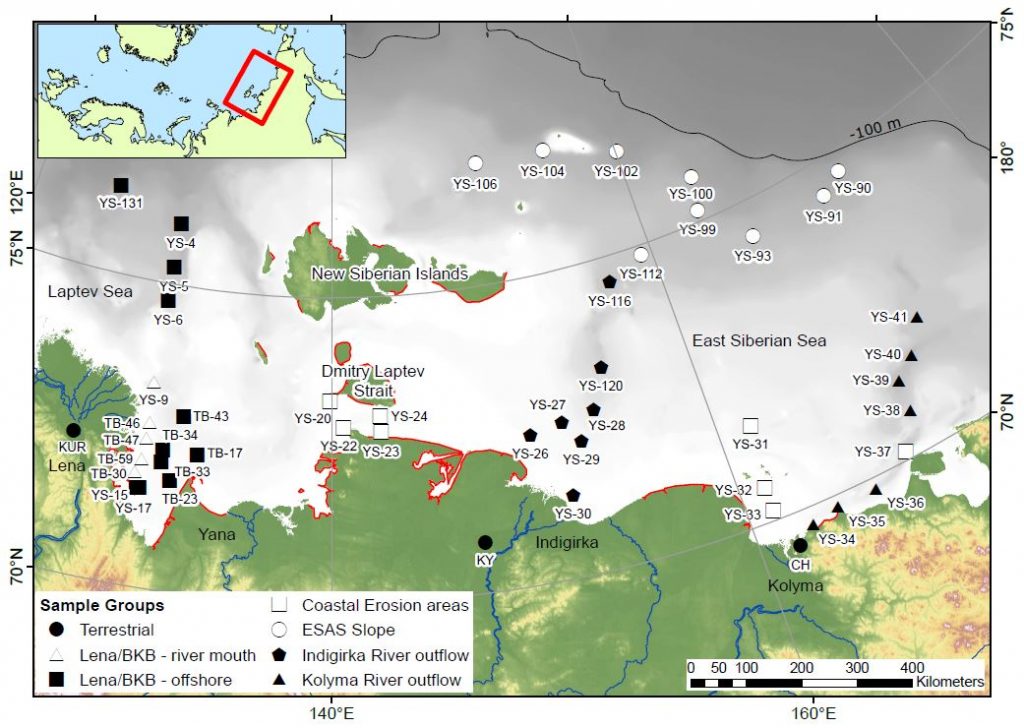
Map of the samples used in this study. Red lines are areas of intense coastal erosion
This study uses the Raman technique on those same Arctic Shelf sediments to look at the sources and distribution of carbonaceous material on the shelf. The samples used in our paper were collected from close to the mouths of some major rivers, from areas experiencing rapid coastal erosion, and from hundreds of kilometres offshore.
Groups of spectra found in the shelf samples
The hardest work, collecting over 1400 Raman spectra, was carried out by two undergraduate students, Melissa Maher and Jerome Blewett, who are co-authors on the paper. The collected spectra were then analysed using an automated peak fitting script, and grouped according to the shape of the fitted peaks. This provides an unbiased method for determining whether a carbon particle is highly graphitised, mildly graphitised, disordered, or somewhere in between. For each of the sites on the shelf we collected spectra from up to 30 particles, and looked at how many fitted into each group. Statistics were then used to spot patterns across the shelf.
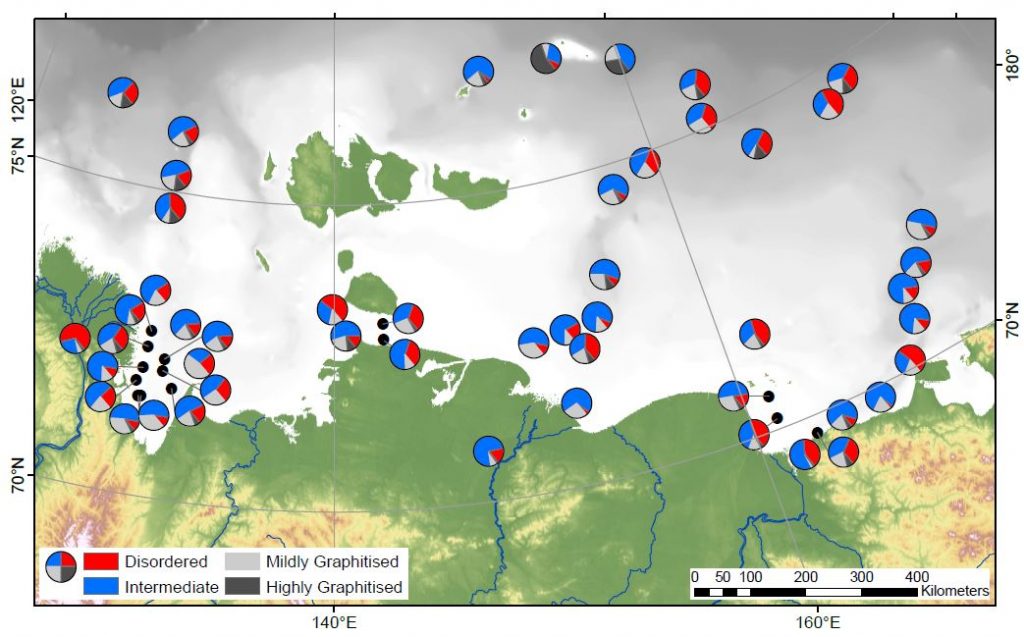
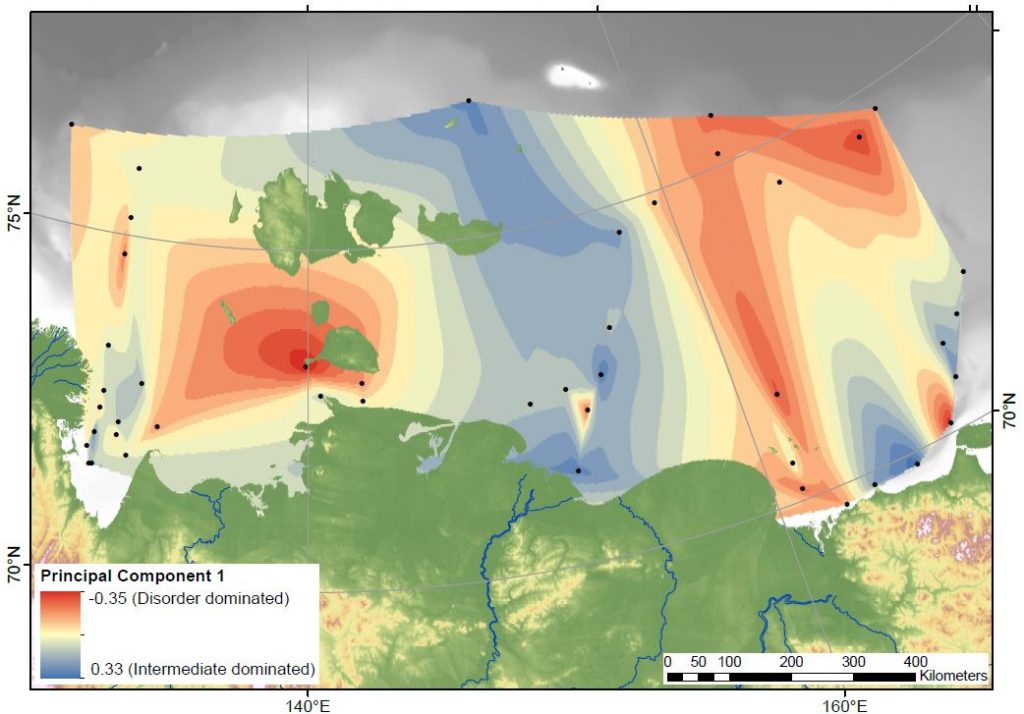
Distribution of “Disordered” and “Intermediate” carbon
Our first finding is that the relative proportion of “disordered” and “intermediate” carbon particles varies, and that there are patches with more of one or the other group. At the coastline these patches align with two of the major rivers (Kolyma and Indigirka) and areas of rapid coastal erosion. Surprisingly, the patches can then be traced all the way across the shelf. We would have expected the currents in the ocean to have mixed the particles together further offshore, and in the biomarker studies we’ve done before we did not spot this kind of pattern. This means that Raman is a great way to trace the different sediment and carbon sources on the shelf.
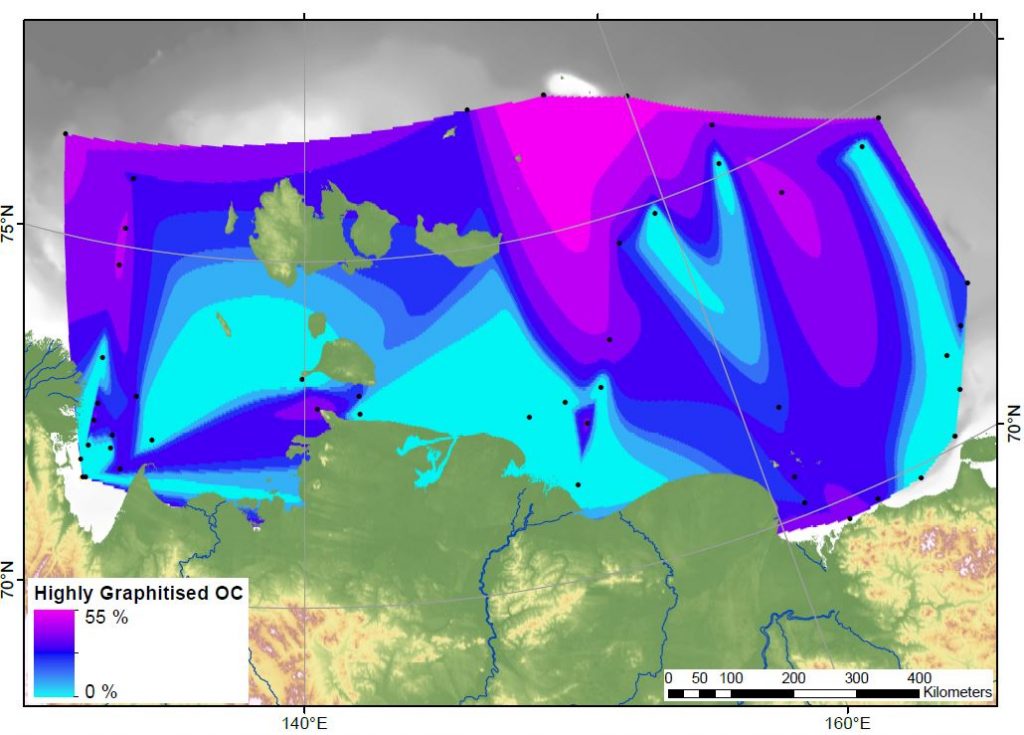
“Highly Graphitised” carbon is found in high proportions far offshore
Our second finding is that the amount of “highly graphitised” carbon particles is highest in the furthest offshore samples. These very crystalline flakes of graphite are behaving differently to all the other carbon particle groups. It’s not clear exactly why this is, but one option is that everything else is breaking down and degrading before getting that far offshore. Or, the graphite particles could be so light that they sink very slowly, floating out to the shelf edge much easier than the other types.
This problem has implications for the global carbon cycle. These carbon particles have been released from permafrost on land and transported for hundreds of kilometres offshore, a trip that has taken thousands of years. If all of the carbonaceous material can survive the journey, it means that this fraction of the organic matter is not at risk of being degraded and released to the atmosphere as greenhouse gases. Burying it in the ocean provides protection from degradation for thousands or millions of years. Future studies should look at just how well the carbon particles can survive erosion and burial.
In summary, carbonaceous material is resilient to degradation and can be used to trace sediment sources across the Arctic shelf.
This paper is a result of collaboration with researchers at the University of Glasgow who I met while interviewing for a position. I didn’t get the job, but I did get talking to Paula Lindgren and we discovered a common interest in using Raman Spectroscopy to study organic carbon. This publication is the first result of that, and is available as an open-access article.
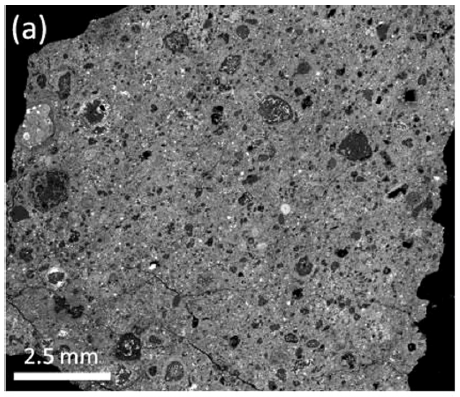
A little bit of meteorite, under an electron microscope
The paper is a comprehensive study of a meteorite collected from Antarctica. Antarctica is a great place to find meteorites because they sit on top of the ice and are easy to spot – sometimes the flow of ice even concentrates them into particular areas to makes things even easier. This meteorite is classified as a “CM carbonaceous chondrite” and has experienced very little change since it was part of the protoplanetary disc billions of years ago. Therefore we can use it like a time capsule to look at what the early solar system was like.
However, some meteorites are better time capsules than others. As they float around the solar system, they can build up ice, which can then be melted by radioactivity and the water released can alter the crystallography of the meteorite. Our paper uses a wide range of techniques to characterise the meteorite and show that it is one of the least altered carbonaceous chondrites ever found.
The techniques used included electron microscopy (both scanning and transmission techniques; SEM and TEM), X-ray analysis, X-ray diffraction, thermogravimetric analysis (TGA), oxygen isotope measurements and Raman Spectroscopy. My contribution was to use my automatic Raman processing technique to determine how crystallised the carbon in this meteorite was in comparison to carbon in other meteorites.
I will discuss Raman Spectroscopy in depth in a future post on this site, but the short version is that Raman allows me to determine the crystal structure of pieces of carbon within my samples. A river or marine sediment sample can be sourced from multiple areas, and mixed together during transport. Trying to work out where a sample was sourced from can prove very difficult. However, these source areas often contain carbon of different crystalline states; if I can identify the carbon particles within a sample then the sources of that sample, even if they have been mixed together, can be worked out. The challenge in this procedure is that there can be lots of carbon particles within a sample, and each one might be subtly different. To properly identify each mixed sample, lots of data is required, which can laborious to process.
Determining the types of carbon in a sample. Each spectrum is classified according to its peak shapes. Image (C) Applied Spectroscopy
My paper describes how lots of spectra can be collected efficiently from a powdered sediment sample. By flattening the powder between glass slides and scanning the sample methodically under the microscope, around ten high-quality spectra can be collected in an hour, meaning five to ten samples can be analysed in a day. Powdered samples are much easier to study than raw, unground, sediment, and I have shown that the grinding process does not interfere with the structure of the carbon particles, therefore it is a valid processing technique.
Once the data has been collected, I have devised a method for automatically processing the collected spectrum using a computer, which removes the time-consuming task of identifying and measuring each peak by hand. The peaks that carbon particles produce when analysed by Raman Spectroscopy have been calibrated by other workers to the maximum temperature that the rock experienced, and this allows me to classify each carbon particle into different groupings. These can then be used to compare various samples, characterise the source material and then spot it in the mixed samples.
Delegating as much analysis as possible to a computer ensures that each sample is treated the same, with no bias on the part of the operator, and also cuts down the time required to process each sample, which means that more material can be studied. The computer script used to analyse the samples is freely available and therefore other researchers can apply this to their data, enabling a direct comparison with any samples that I have worked on. This technique will hopefully prove useful to more than just my work in the future, and anyone interested in using it is welcome to contact me. While the paper discusses my application of the technique to Taiwanese sediments, I have already been using it to study Arctic Ocean material as well.
The paper itself is available from the journal via a subscription, and is also deposited along with the computer script in the University of Manchester’s open access library.